SMEAR II Data - picarro114
At this page an overview of data flow and processing of the continuous greenhouse ICOS atmospheric measurements is given.
The measurements are done with Picarro G2401. The measurement setup is described here.
1. Data flow
Picarro G2401 saves data into daily files (location at the instrument hard drive: /UserData/DataLog_User/YYYY/MM/DD/). The instrument is mounted and can be accessed via Timo (/mnt/picarro114_data/). The daily files are named like CFKADS2134-YYYYMMDD-hhmmssZ-DataLog_User.dat, where the time corresponds to the beginning of the file. If the measurements are stopped for a while (rebooting the instrument, malfunctioning etc.) then a new file is started and the name of the new file corresponds to the start of the new measurement period. Thus the daily folders (/UserData/DataLog_User/YYYY/MM/DD/) may contain several files if the instrument has been shut down during the day. However, usually data from one day is in one file.
The files are copied twice per day to atm-raw (folder: /picarro114/). It is the final storing location of Picarro raw data. The Picarro raw data on atm-raw is saved on daily folders (/picarro114/YYYY/MM/DD/). In addition to this data flow path, the data is copied several times a day directly from the instrument to a virtual server (atm-mitta (\\ad.helsinki.fi\dept\phys-data\groups1), N.B. this may change) from where the data is used in online processing. The online processing takes place at hippuko computer (see Sect. 2 for data processing). The online processed data is saved on aella (see Sect. 2 for data processing) in folder /h528/smear/hyytiala/picarro114/preprocessed/ and the final processed data is saved in /h528/smear/hyytiala/picarro114/processed/. The processed data is also saved in the database (can be accessed via http://avaa.tdata.fi/web/smart/smear). From 1.1. 2017 on the data in SMEAR database are flagged as preliminary online data. Final data can be downloaded from ICOS ATC (ATC user account required) and eventually publicly available at Carbon Portal.
In addition to online processing, the data is sent to ICOS ATC server (icos-ssh.lsce.ipsl.fr). Before sending, the calibration/target gas valve information is attached to the Picarro data from pic_cal.log file. In addition to picarro data, also meteorological data (T, RH, wind speed and wind direction at Picarro sampling heights, air pressure at 30 m height) and diagnostic data (buffer and sample flows, standard gas storage conditions) are sent to the ICOS ATC server. The script collection is located on timo, see scripts and documentation on /home/smear/matlab/icos.
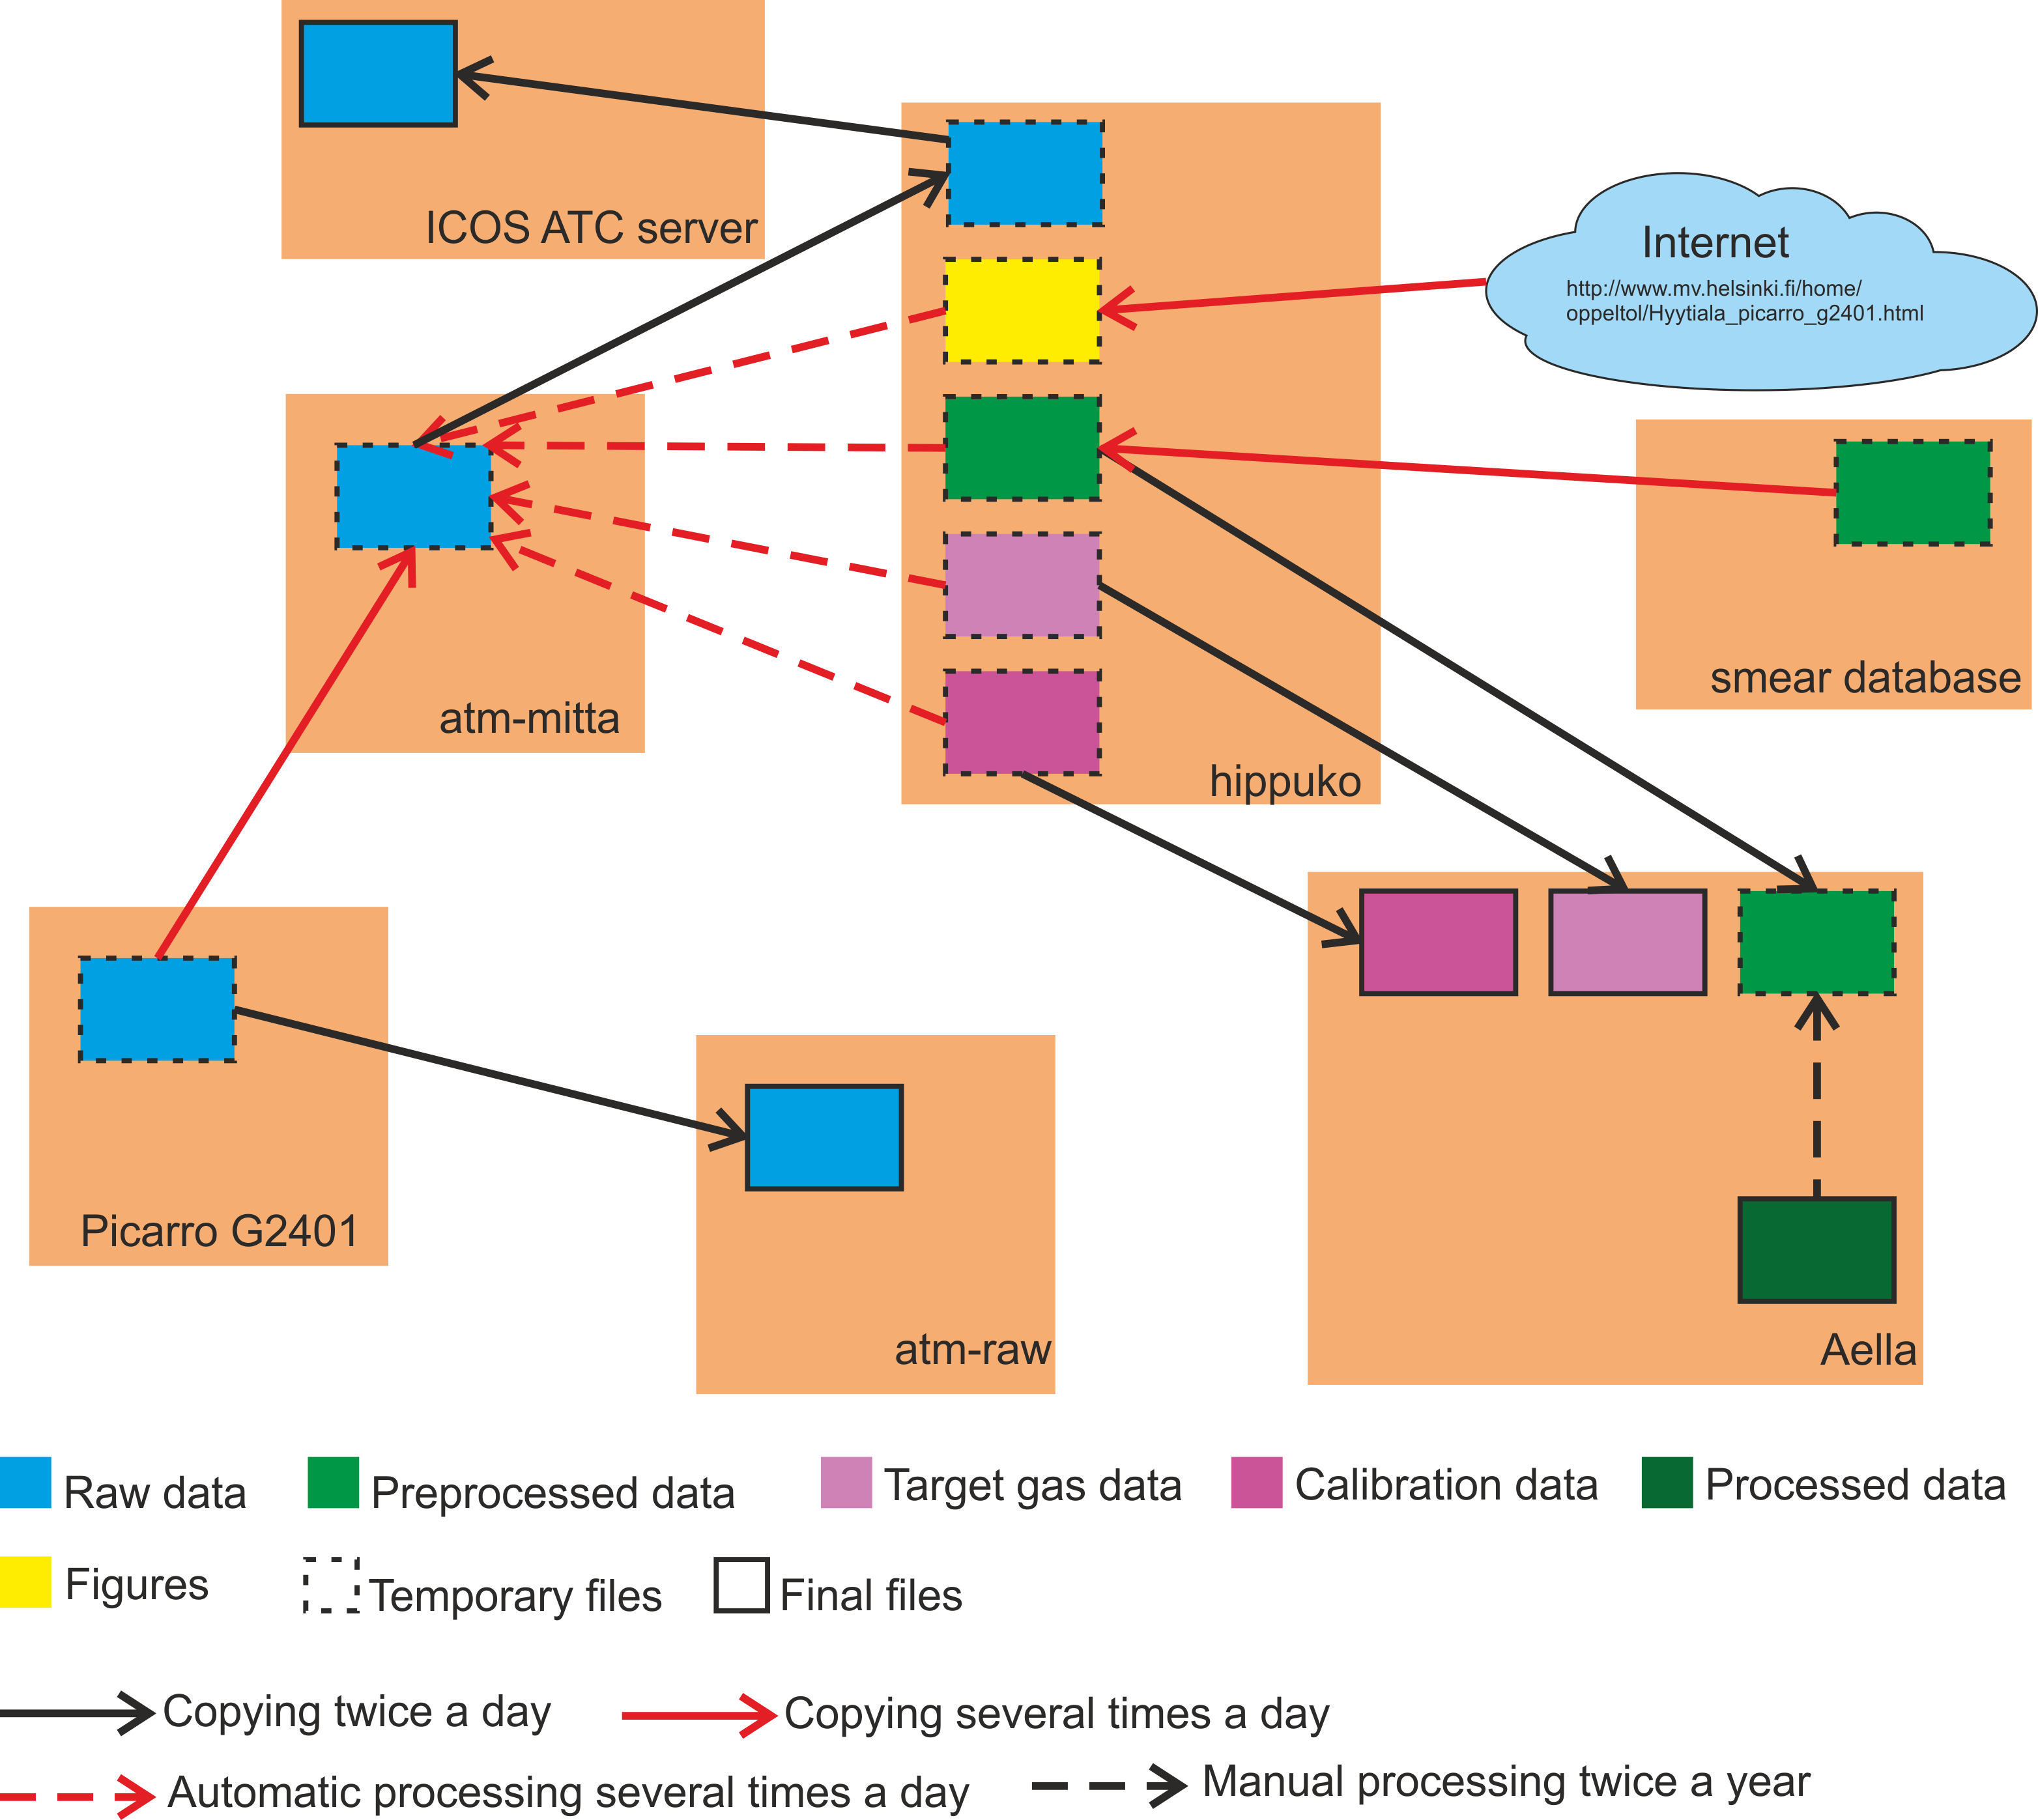
2. Data processing
Picarro data is processed automatically several times a day at hippuko computer. The data is processed with several Matlab codes and the currently implemented codes can be found on aella (folder: /h528/smear/hyytiala/matlab/picarro114/). The codes produce preprocessed data with 2 min and 30 min averaging as well as plenty of diagnostic graphs. The codes are shortly introduced here:
process_and_plot_picarro_g2401.m: This is the main processing code which is run several times a day and this code calls the other functions and scripts. First the current day Picarro raw data is loaded from atm-mitta, in addition to preprocessed data from the previous seven days, target gas and calibration data from hippuko. Also the raw flow data (GADiag_data files, columns 10, 34...39) from the previous eight days is loaded from atm-mitta. The flow measurements are saved in the GADiag_data-files in units mV (except main flow data is saved in 10mV), these are converted into meaningful units (ml min-1) and then averaged over 30 min. After loading the data function ‘cal_target_gases_picarro_g2401.m’ is called. If calibration or target gas sampling was detected by 'cal_target_gases_picarro_g2401.m’, then the results will be updated to calibration and target gas files. The loaded Picarro data is then calibrated using the latest calibration coefficients, averaged over each 2 min sampling period and also over 30 min (average_data_picarro_g2401.m), quality screened (screen_data_picarro_g2401.m) and then outputted (output_picarro_g2401.m). As final step, the process_and_plot_picarro_g2401.m code plots several diagnostic figures which are saved at web server http://www.atm.helsinki.fi/pics/picarro/ and also displayed on the Online data page. The figures are always updated when the code is run, which is several times a day.
cal_target_gases_picarro_g2401.m: This code automatically detects and processes instrument calibration and target gas sampling data. First seven minutes of calibration and target gas sampling are discarded due to flushing the sampling lines, filters etc. and the remaining (usually 5 to 8 min) data is used to estimate the concentrations. Simple linear regressions are used to estimate the offset and gain of CO2, CH4 and CO measurements. The calibration and target gas sampling periods and the calibration curves are plotted and the figures are saved. If the calibration coefficients are out of the expected range, the coefficients are not outputted.
average_data_picarro_g2401.m: This code divides the raw Picarro data into separate sampling periods from different heights based on the flag ‘solenoid_valves’ in the Picarro data which tells which solenoid valve was open (i.e. which height was measured). The first 45 seconds from each 2 min sampling period are discarded due to flushing of sampling line, filter etc. and the rest are used to calculate mean concentrations.
screen_data_picarro_g2401.m: Some automatic data screening is done in order to remove clearly erroneous data already during the automatic data processing step.
output_picarro_g2401.m: This code outputs the preprocessed picarro data into three different files: two concentration files (2 min averaging: picarro_conc_YYYYMMDD.dat and 30 min averaging: picarro_conc_30min_YYYYMM.dat ) and one diagnostic file (picarro_diag_YYYYMMDD.dat).
print_picarroplot.m: Function used to save the plotted figures.
init_processing_picarro_g2401.m: A script which initialises the picarro data processing.
3. Description of picarro raw data files
Picarro raw data files are ASCII files (UTF-8 character encoding) which contain data with a time step of approximately 1 second. Column delimiter is space (‘ ’). The following column order is requested by ICOS ATC and it should not be changed!
DATE: date (YYYY-MM-DD)
TIME: time (hh:mm:ss.sss) N.B! These are in UTC!
FRAC_DAYS_SINCE_JAN1: running day after January 1st N.B! This is in UTC+2
FRAC_HRS_SINCE_JAN1: running hour after January 1st N.B! This is in UTC+2
JULIAN_DAYS: Julian day N.B! This is in UTC+2
EPOCH_TIME:?
ALARM_STATUS: Flag telling if the instrument is in alarm state. Equals 0 if everything is ok.
INST_STATUS: Flag telling what the instrument is doing. Equals 963 during normal measurement
CavityTemp: Temperature inside the cavity (measurement cell). Should be constant. Units °C
CavityPressure: Pressure inside the cavity (measurement cell). Should be constant.
DasTemp: Temperature of the DAS box (follows quite closely the cabin temperature).
OutletValve: Value which tells how open/closed the valve behind the cavity is. The valve is used to control the cavity pressure. 15000 (valve fully closed) and 65000 (valve fully open).
solenoid_valves: Flag telling which height is measured (2= calibration, 1=16.8m, 4=67.2m, 8=125m)
species: ?
CO2: CO2 wet molar mixing ratio in ppm
CO2_dry: CO2 dry molar mixing ratio in ppm
CH4: Methane wet molar mixing ratio in ppm
CH4_dry: Methane dry molar mixing ratio in ppm
h2o_reported: water vapour mixing ratio measured prior to the correction in % (0.1 mmol mol-1)
EtalonTemp: Temperature of Etalon
co2_base: ? (laser signal attenuation next to CO2 absorption line?)
ch4_base: ? (laser signal attenuation next to CO2 absorption line?)
wlm1_offset: ?
wlm2_offset: ?
co2_pzt_std: ?
ch4_pzt_std: ?
CO: Carbon monoxide dry molar mixing ratio in ppm
b_h2o_pct: ?
peak_14: ?
peak84_raw: ?
co_pzt_std: ?
final_base84: ?
wlm5_offset: ?