Hyytiälä ICOS Atmospheric measurements (greenhouse gases)
Picarro G2401 gas analyzer
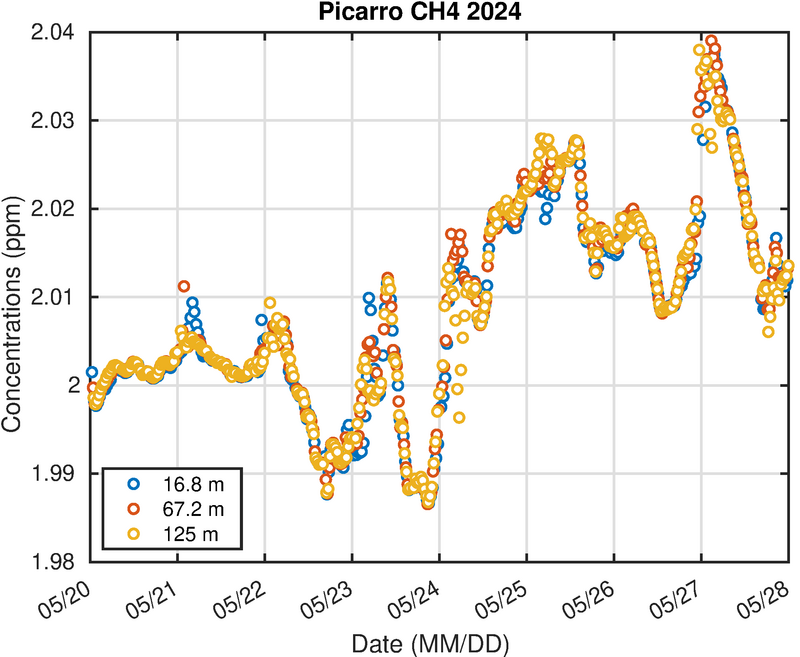
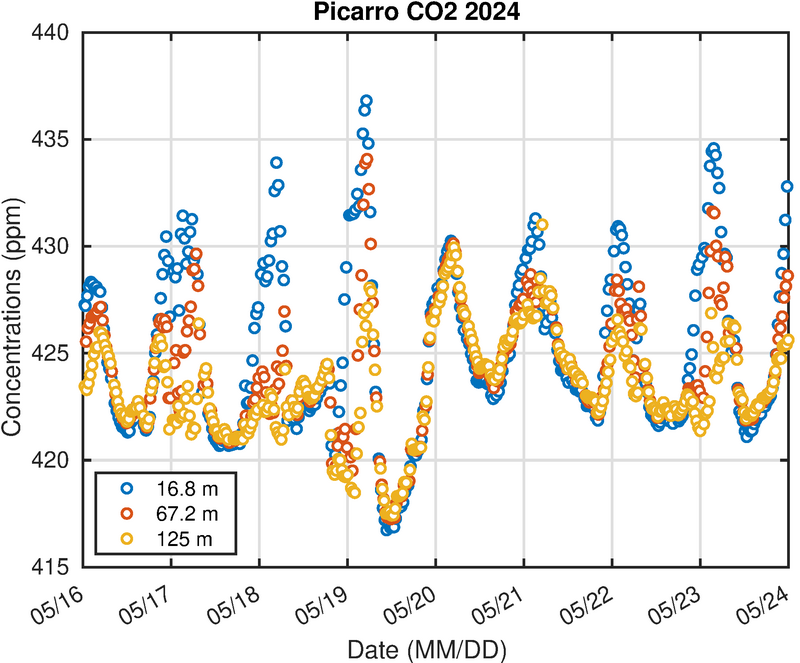
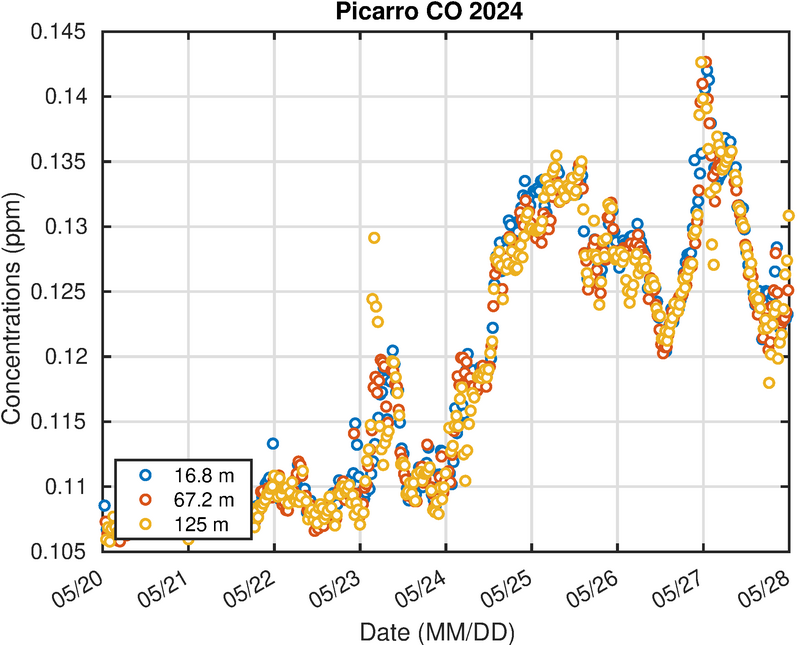
The instrument is measuring CO2, CH4, CO and H2O at Hyytiälä SMEAR II site (61 51'N 24 17'E, 181 m a.s.l).
Three levels are measured (16.8m, 67.2m and 125m), each 10 minutes at a time. Buffer volumes (5.6 l) are used to average out the high frequency variation in the concentrations allowing simultaneous measurements from all levels with one instrument.
For more information about the measurements, contact Petri Keronen (petri.keronen (at) helsinki.fi)
Link to a Grafana window:
mast picarro sequencer status
The figures are updated several times in a day.
In case the plots produced by ATC are not up to date you might find more recent versions here.
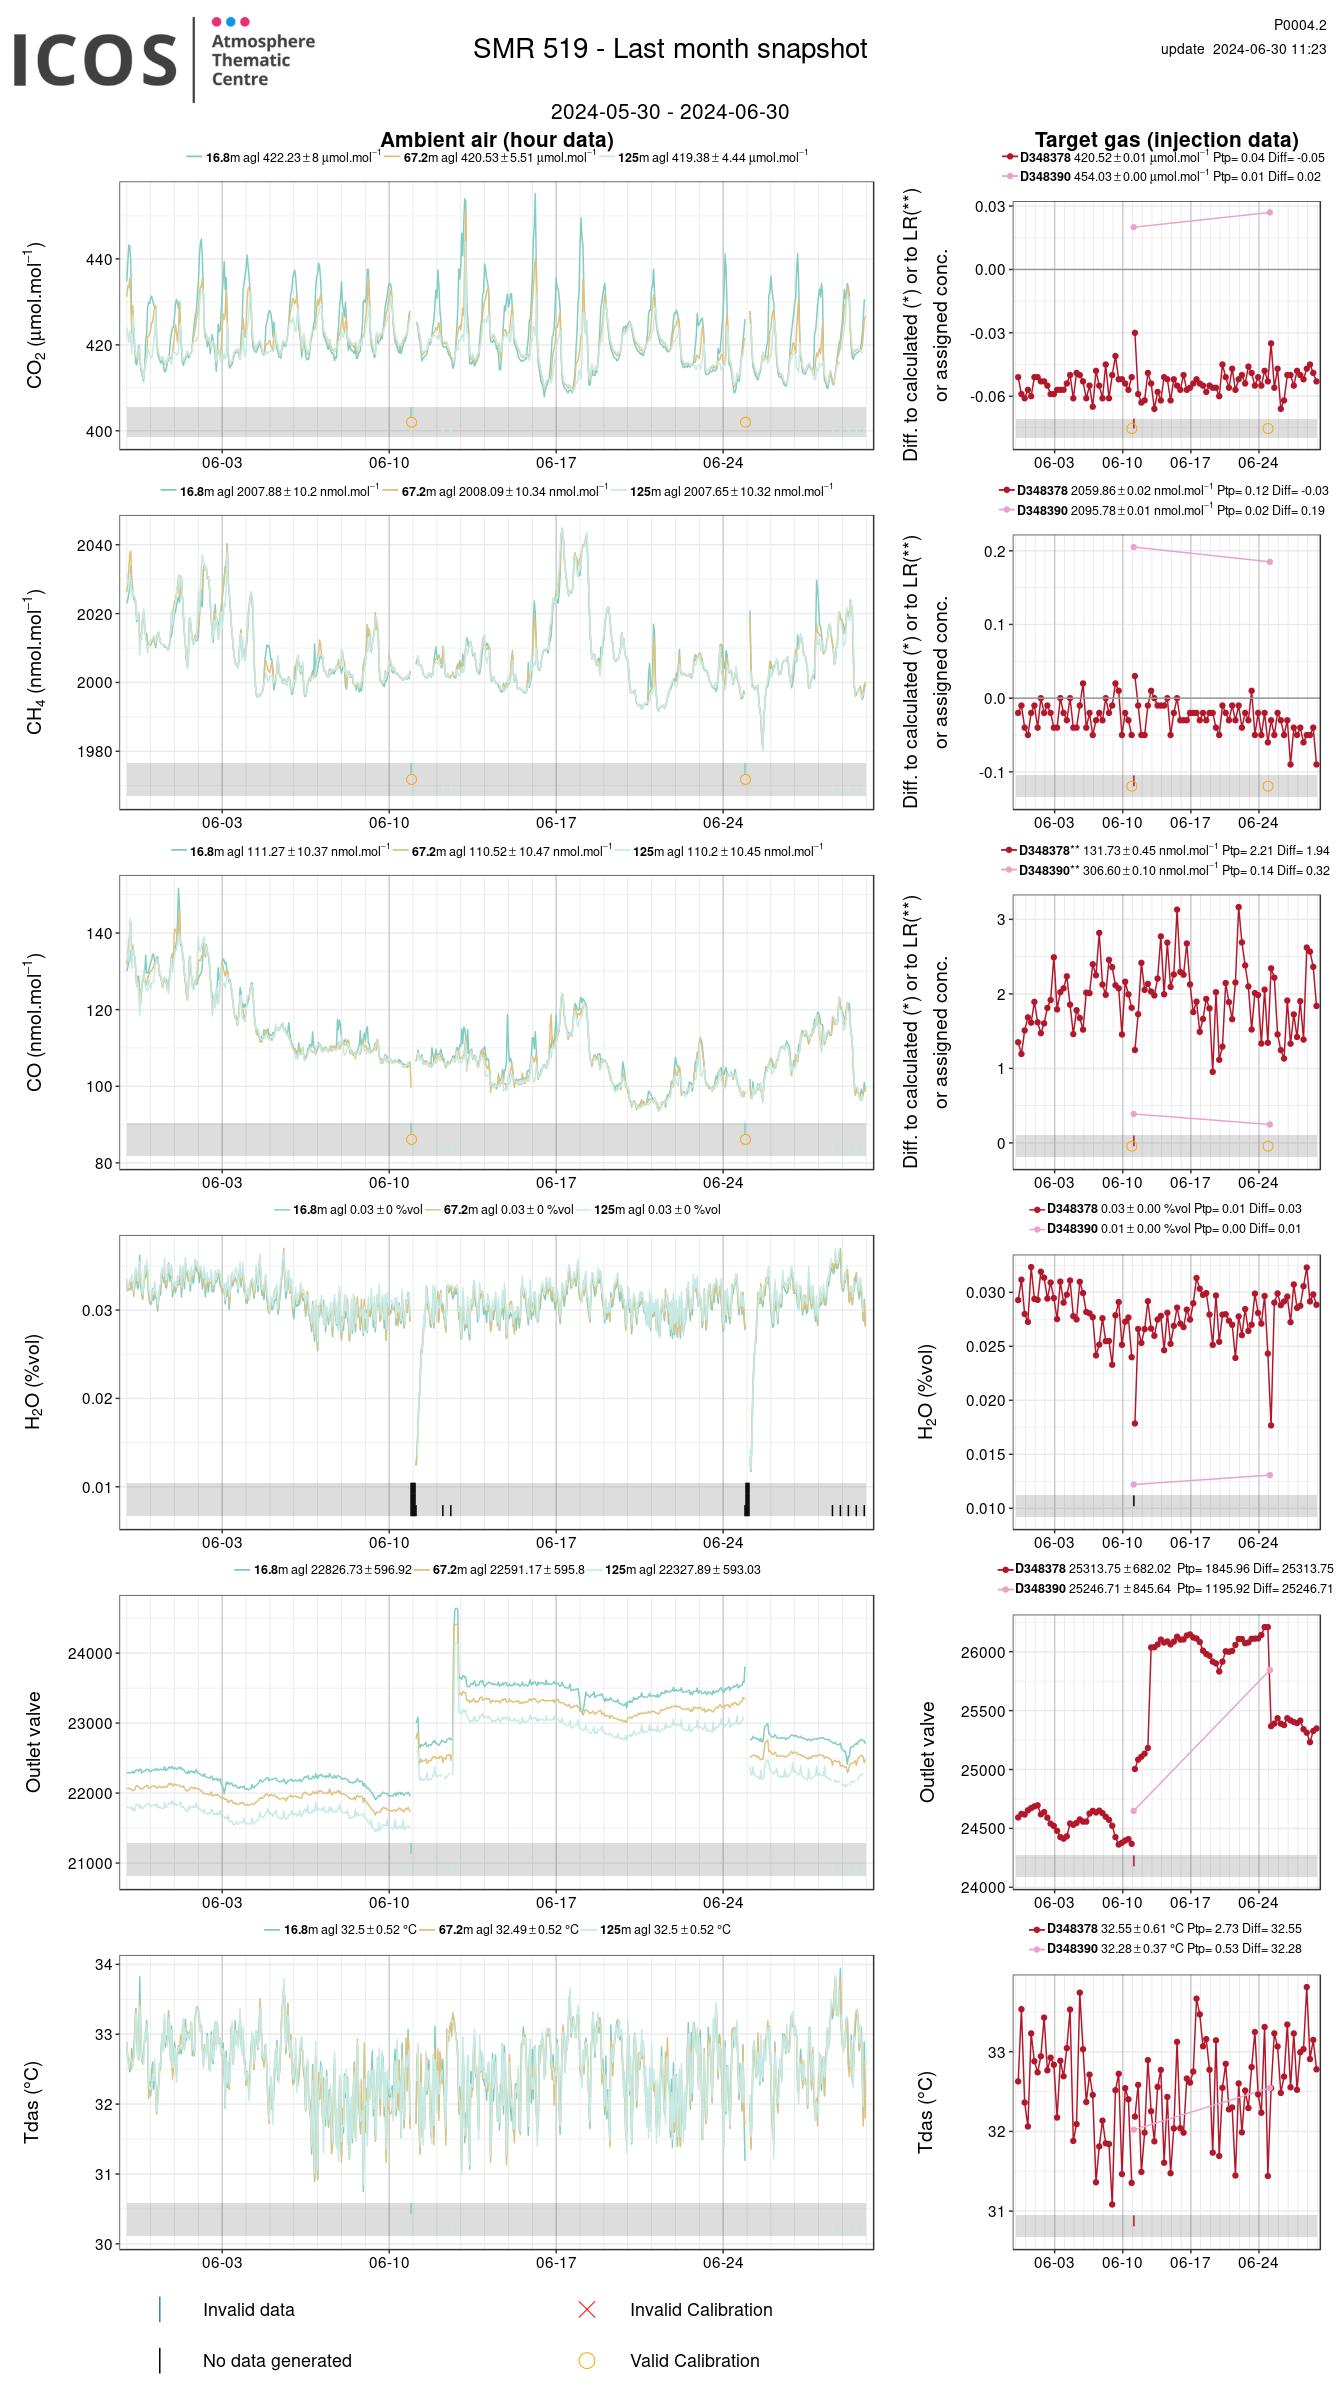
Data from last month (ICOS ATC):
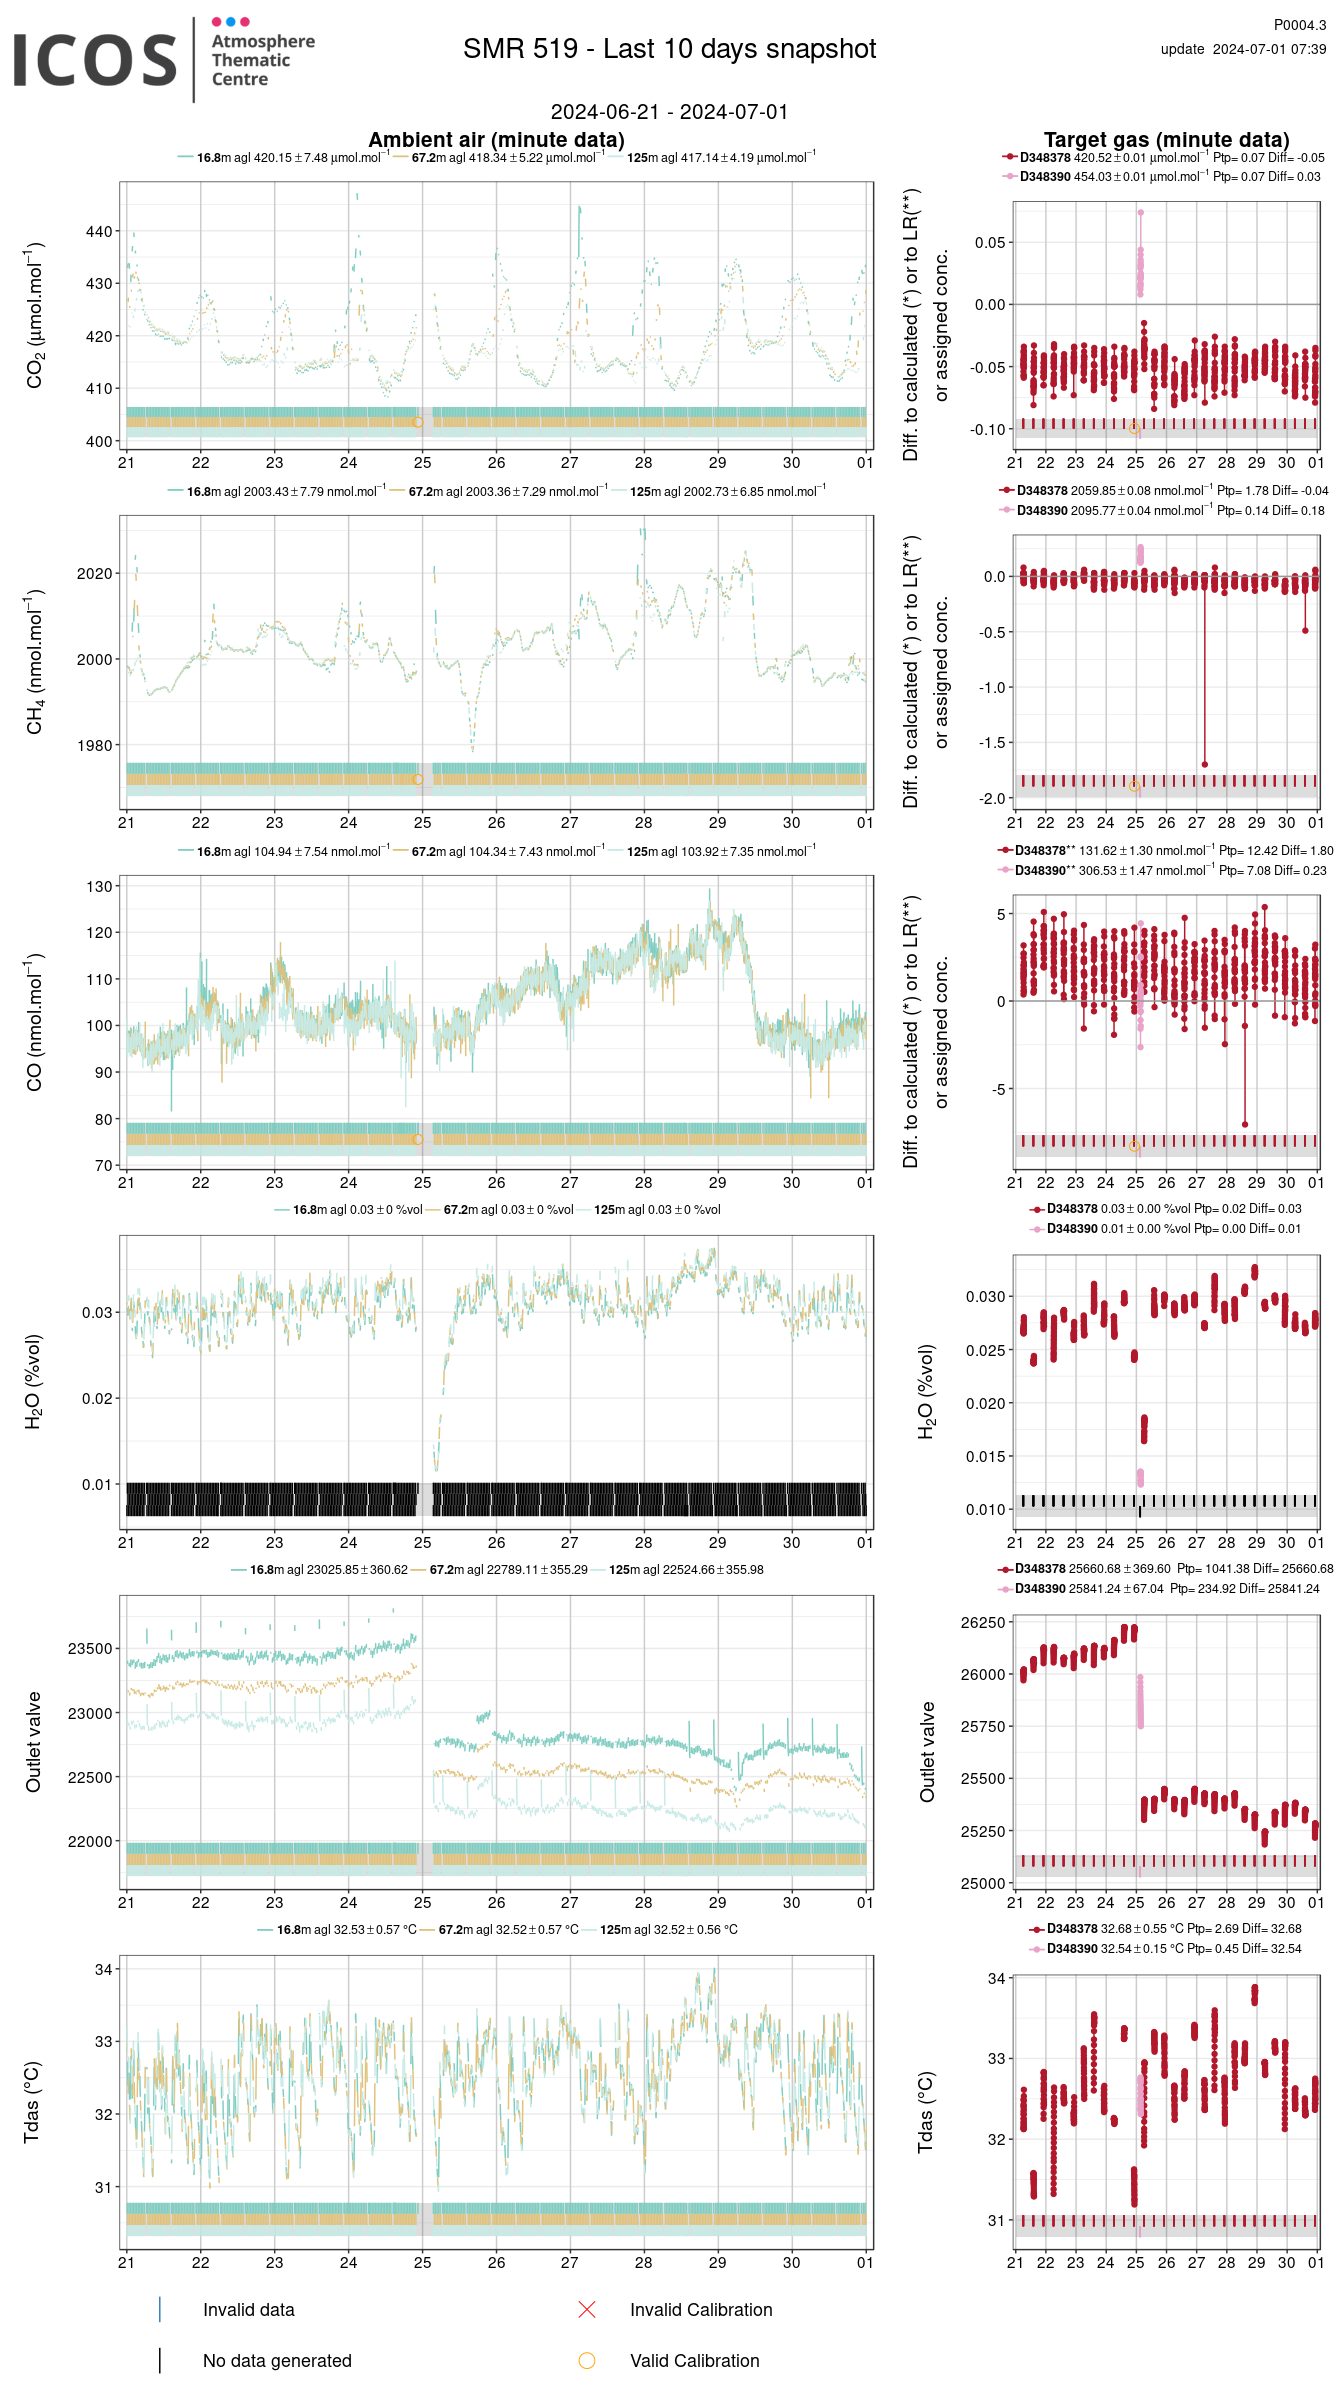
Data from last 10 days (ICOS ATC):
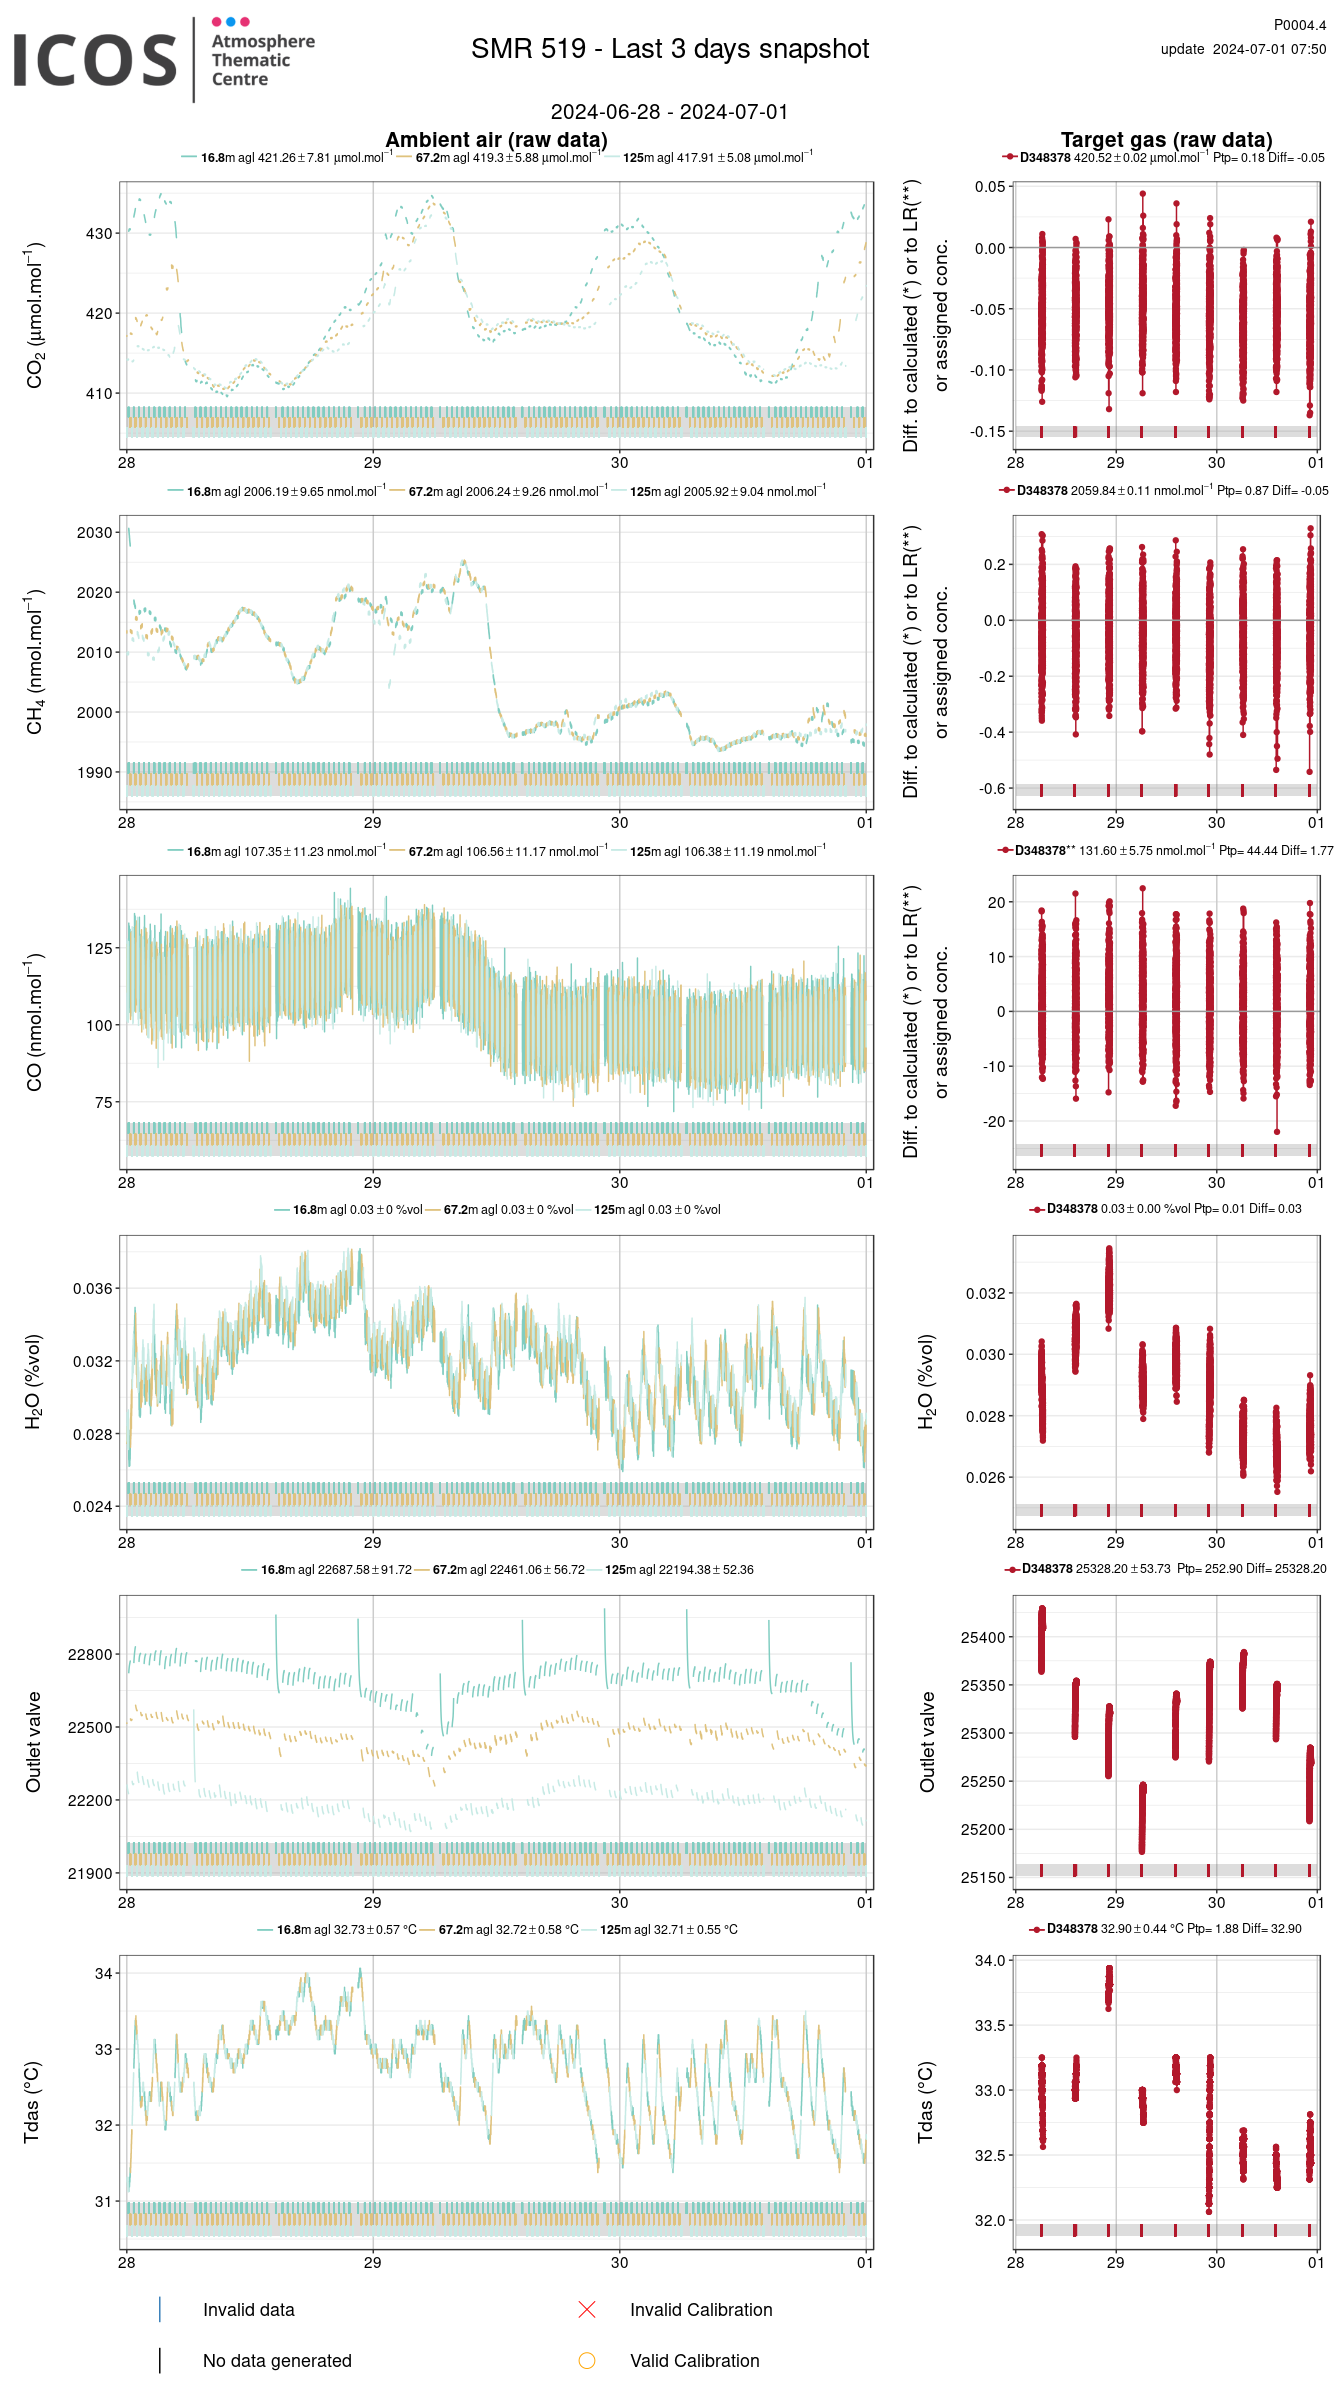
Data from last 3 days (ICOS ATC):
Diagnostic data from the last month (ICOS ATC):
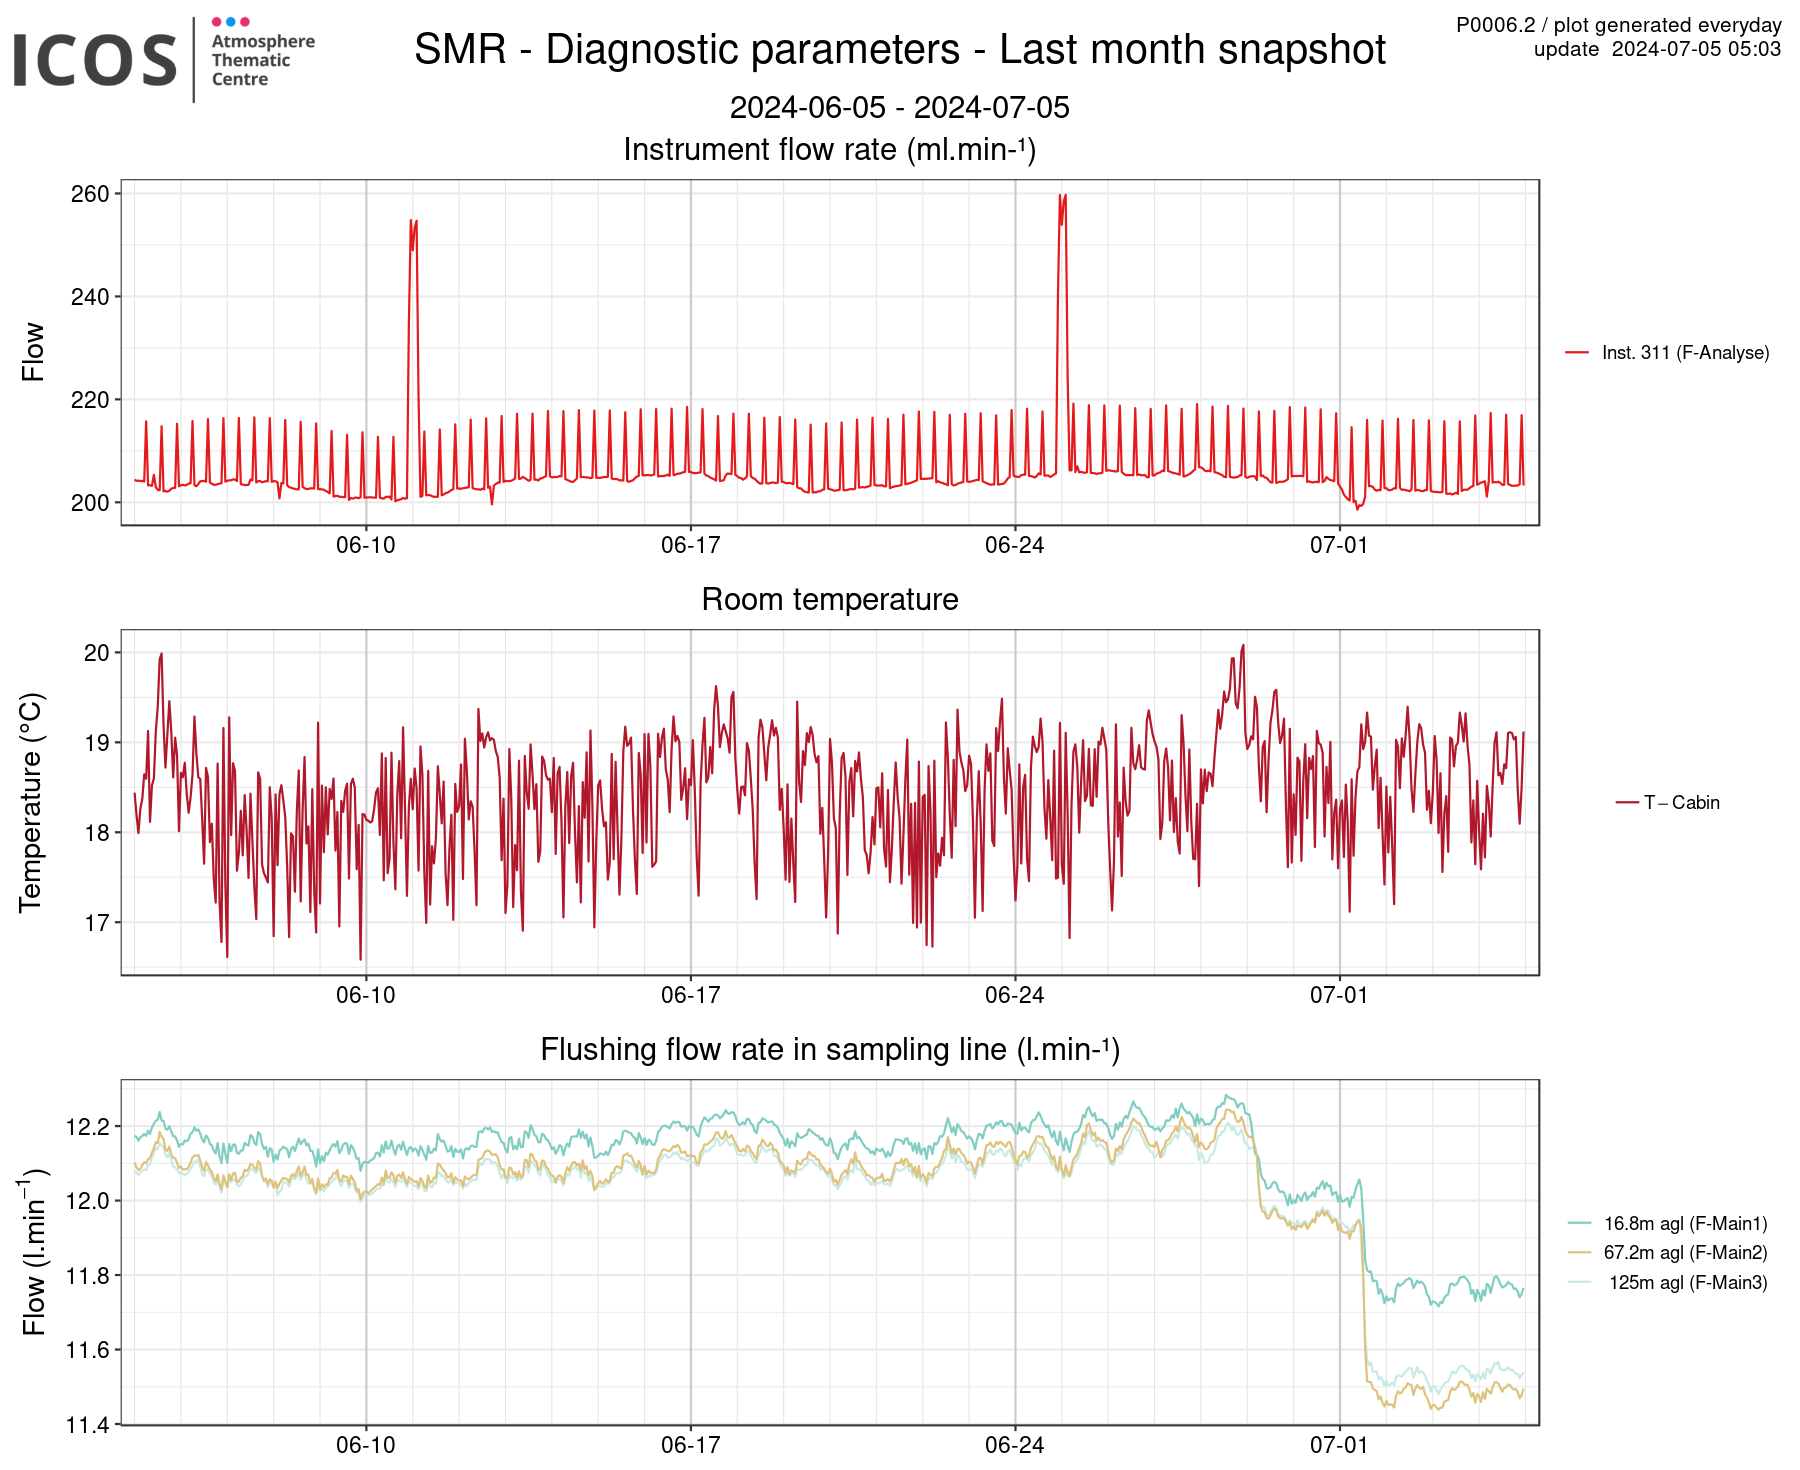
Top: Flow through the instrument (aka sample flow), The in-situ sample flow rate should be around 200 ml/min (+/- 10 ml/min). The daily runs of the target gas have a higher flow rate andthis causes the seemingly peaks in the data. Likewise the bi-monthly calibration runs causes the highest sample flow rates in the data.
Middle: Temperature inside the cottage.
Bottom: Flushing (aka F-Main) flows in the sample lines (F-Main1=16.8 m level, F-Main=67.2 m level, F-Main3=125 m level). All the F-Main flows should be about 12 l/min.
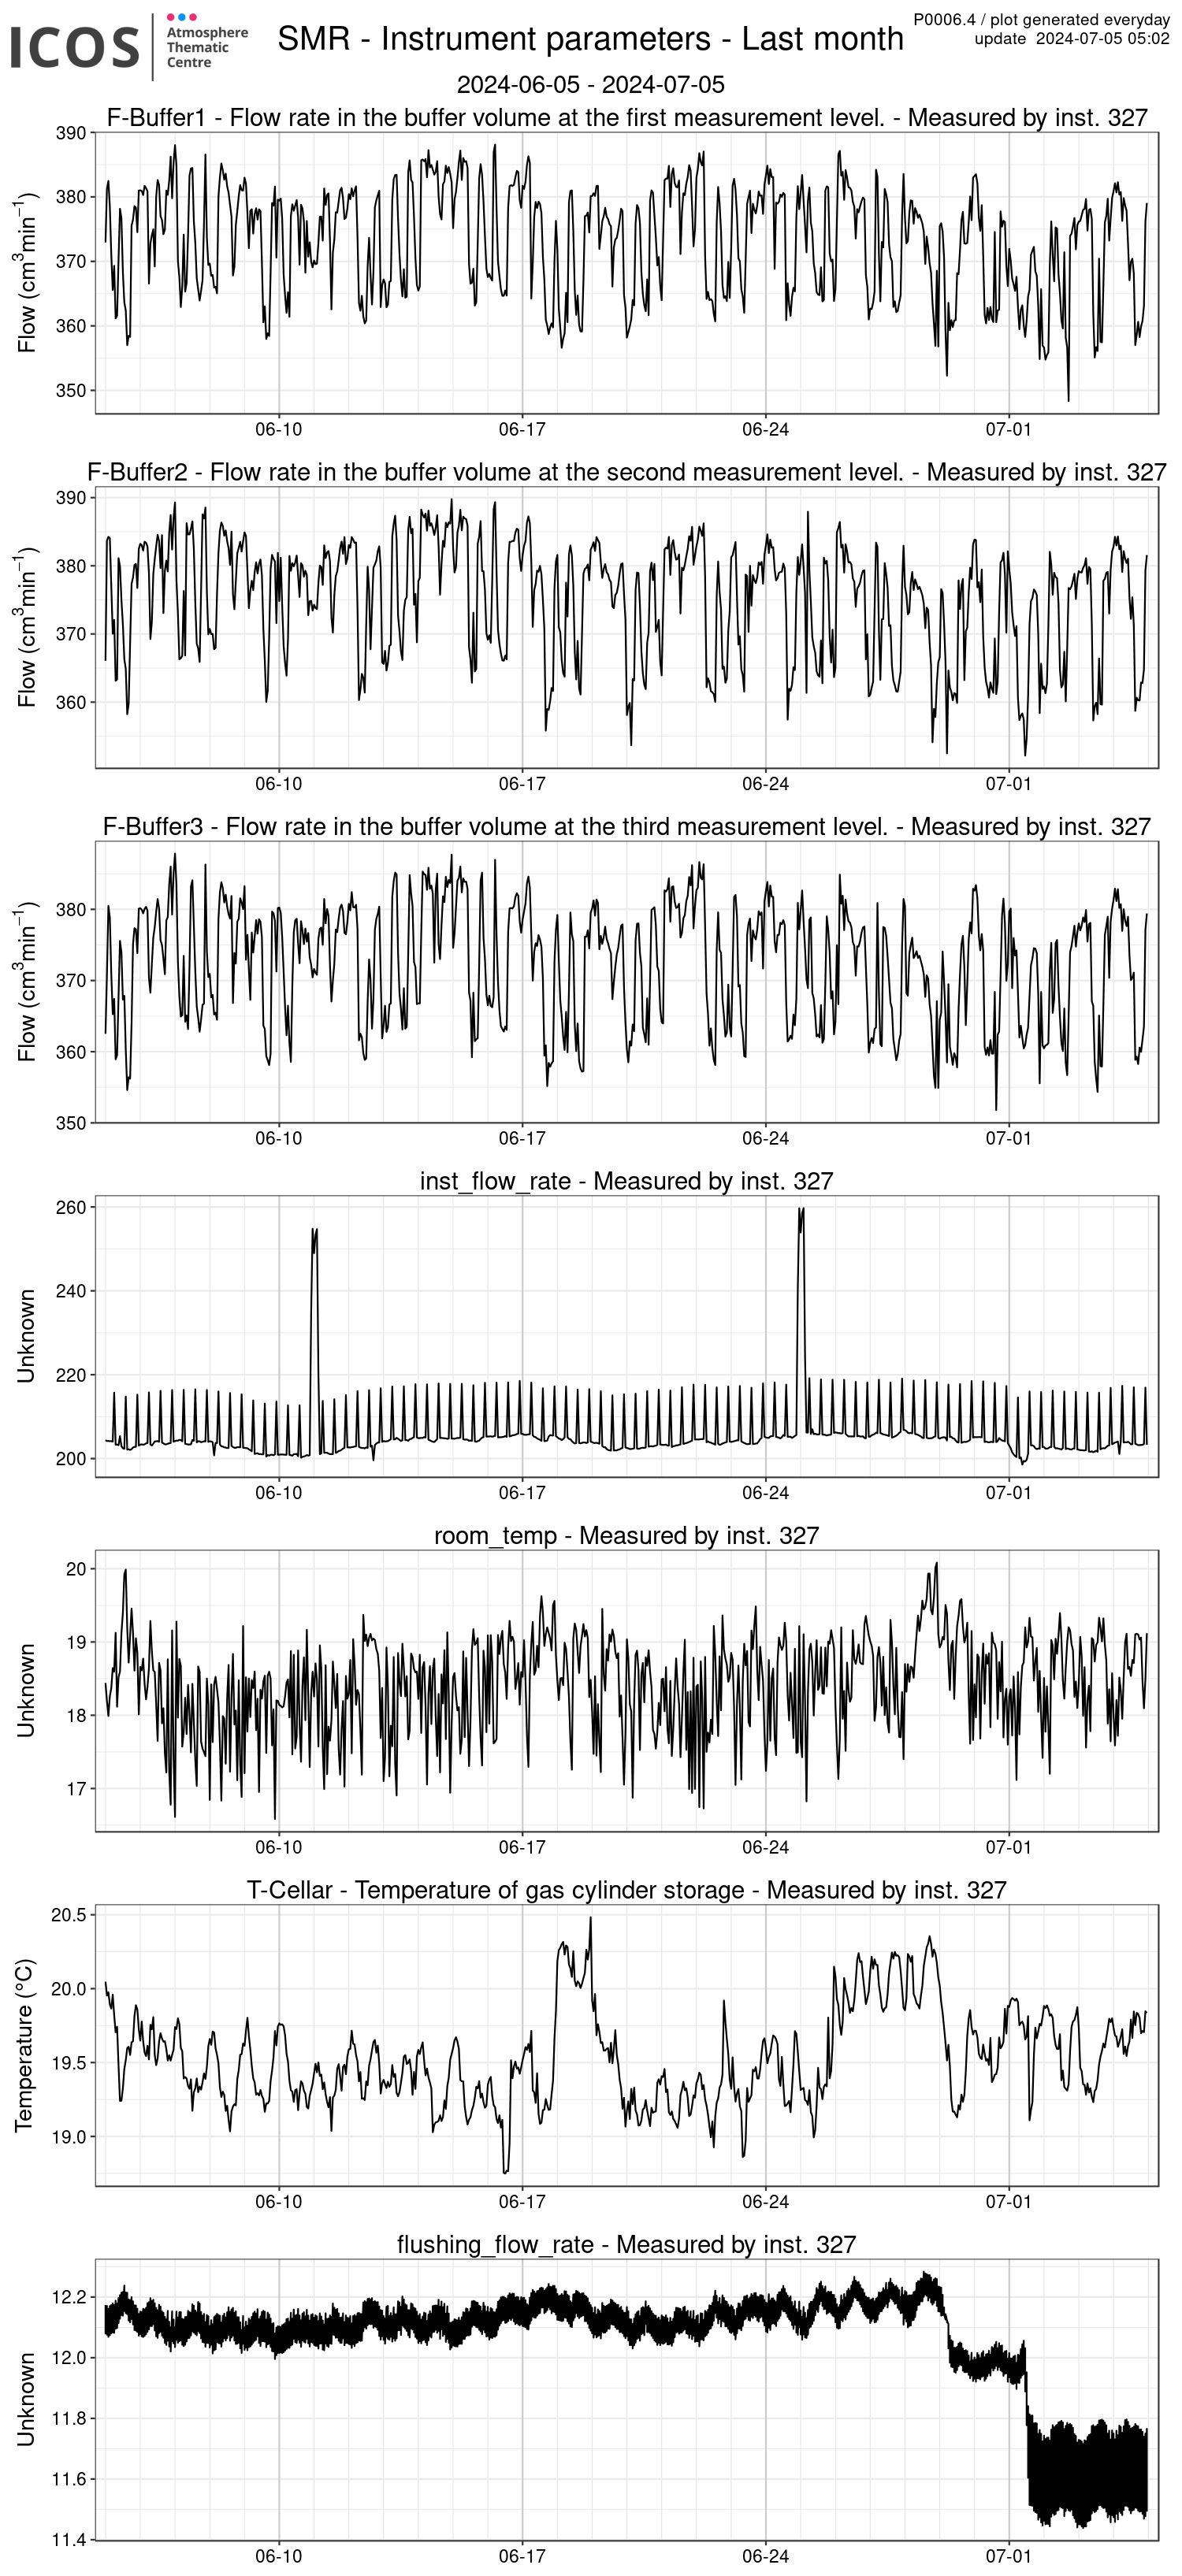
Top 1: Flows through the buffer volumes in ml/min (F-buffer1=16.8 m level, F-buffer2=67.2 m level, F-buffer3=125 m level). In order to get correct averaging with the buffer volumes the flow through the volumes should ideally be the same for all levels with approximate value 350 ml/min (acceptable interval between 320 ml/min and 390 ml/min).
Middle 4: Sample flow through the instrument in ml/min.The sample flow should be around 200 ml/min (+/- 10 ml/min) for the in-situ measurement levels. During the target gas measurements (3 times per day) and the calibration measurements (twice a month) the sample flow rate is higher.
Middle 5, 6: Temperature inside the instrument cottage/cabin and inside the basement where the target and calibration gas cylinders are located.
Bottom 7: Flushing (aka F-Main) flows in the sample lines (F-Main1=16.8 m level, F-Main=67.2 m level, F-Main3=125 m level). All the F-Main flows should be about 12 l/min.
Flow diagnostic data from the past week (local processing):
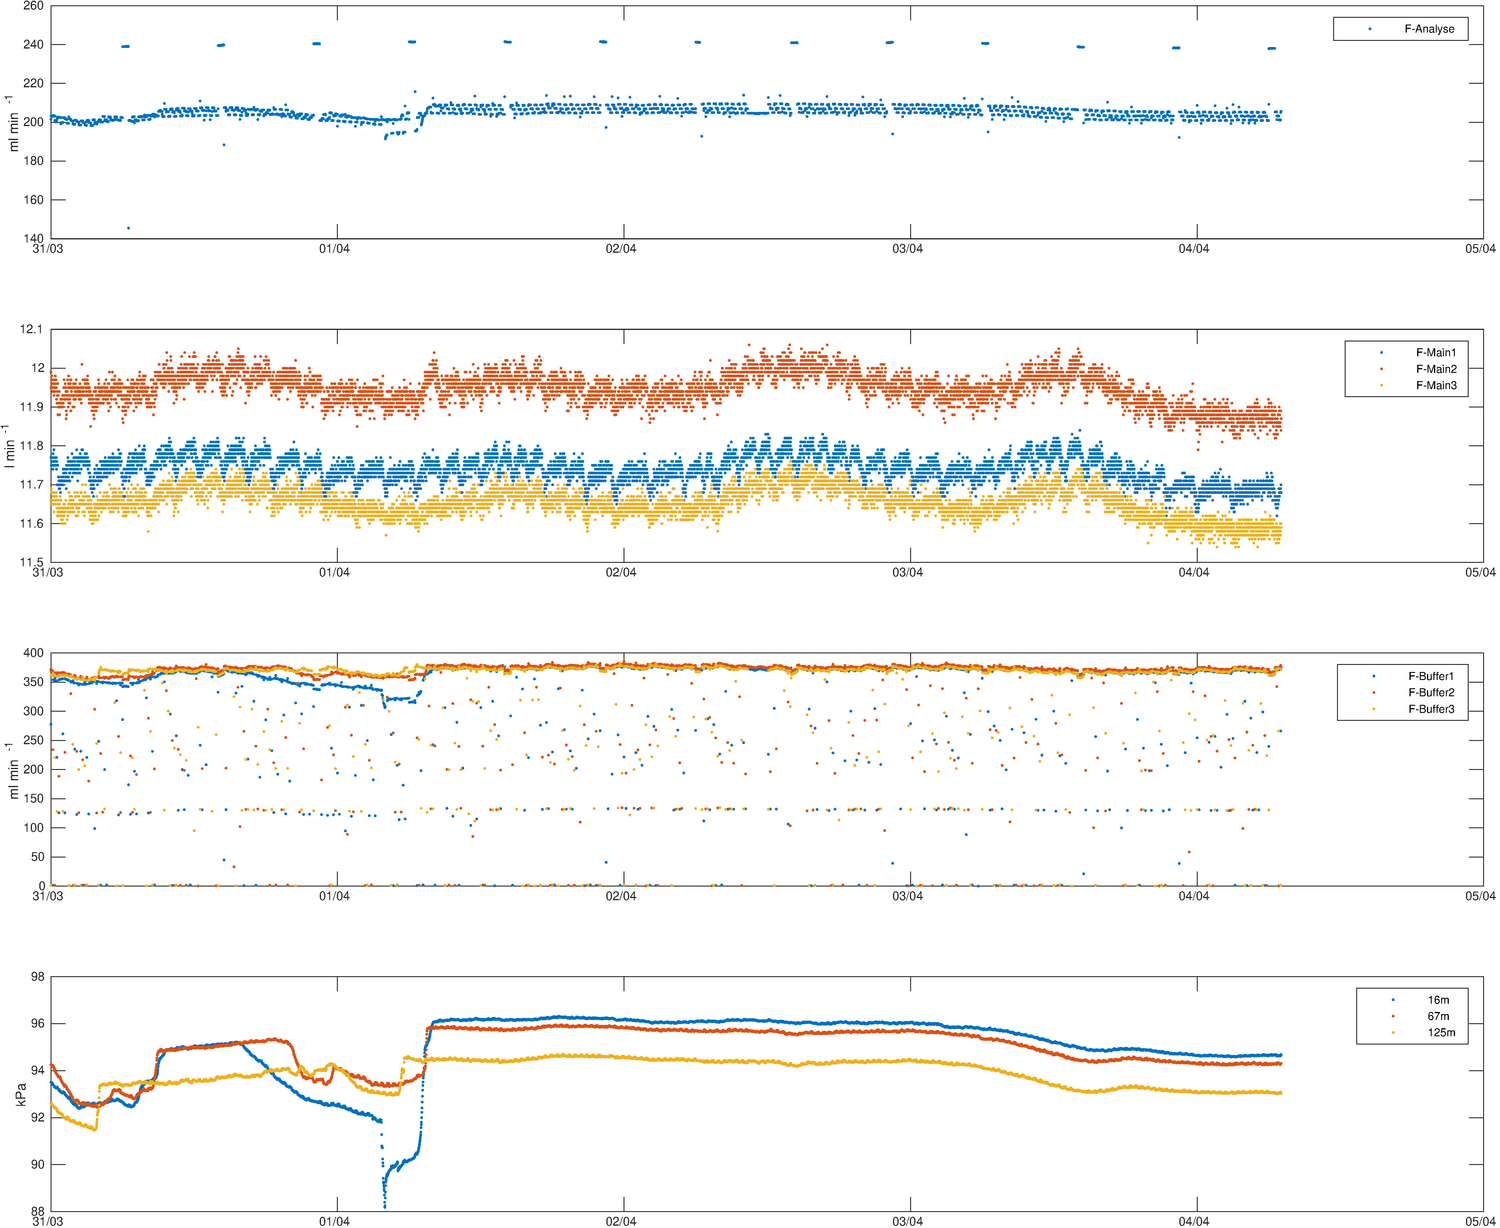
Top 1: Sample flow through the instrument in ml/min.The sample flow should be around 200 ml/min (+/- 10 ml/min) for the in-situ measurement levels. During the target gas measurements (3 times per day) and the calibration measurements (twice a month) the sample flow rate is higher.
Top 2: Flushing (aka F-Main) flows in the main sample lines (F-Main1=16.8 m level, F-Main=67.2 m level, F-Main3=125 m level). All the F-Main flows should be about 12 l/min.
Bottom 3: Flows through the buffer volumes in ml/min (F-buffer1=16.8 m level, F-buffer2=67.2 m level, F-buffer3=125 m level). The flows should be about the same for all levels with approximate value 350 ml/min (acceptable interval between 320 ml/min and 390 ml/min).
Bottom 4: Pressures in the main sample lines (F-Main1=16.8 m level, F-Main=67.2 m level, F-Main3=125 m level). Pressure below 90 kPa is an indication of clogging of filter at inlet of the sample line. The reason for temporary clogging is usually ice/frost buildup. More constant clogging can be sign of a dirty filter.
Diagnostic data from the last data collection run (local processing):

Data from the past week (local processing):
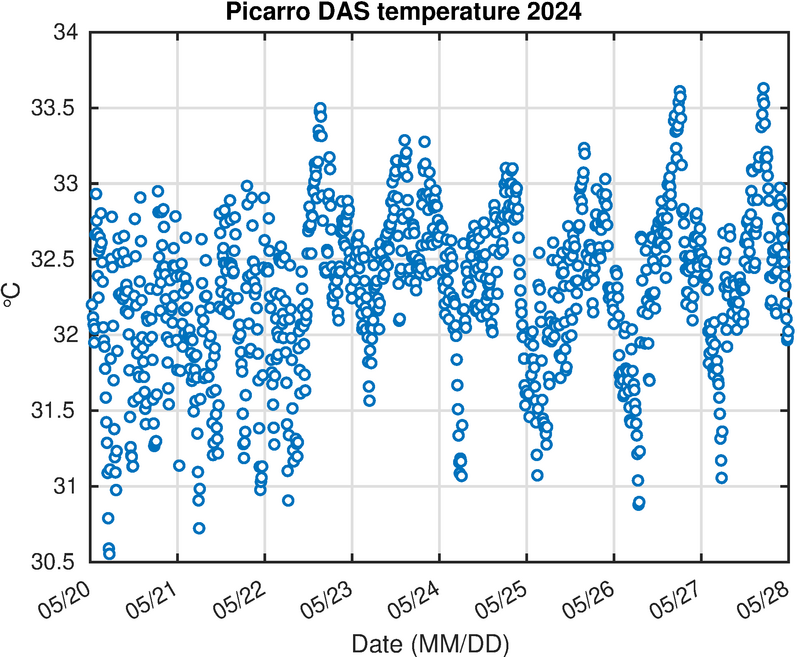
The internal temperature of the Picarro analyser. It should be < 40 C.
Calibration and target gases:
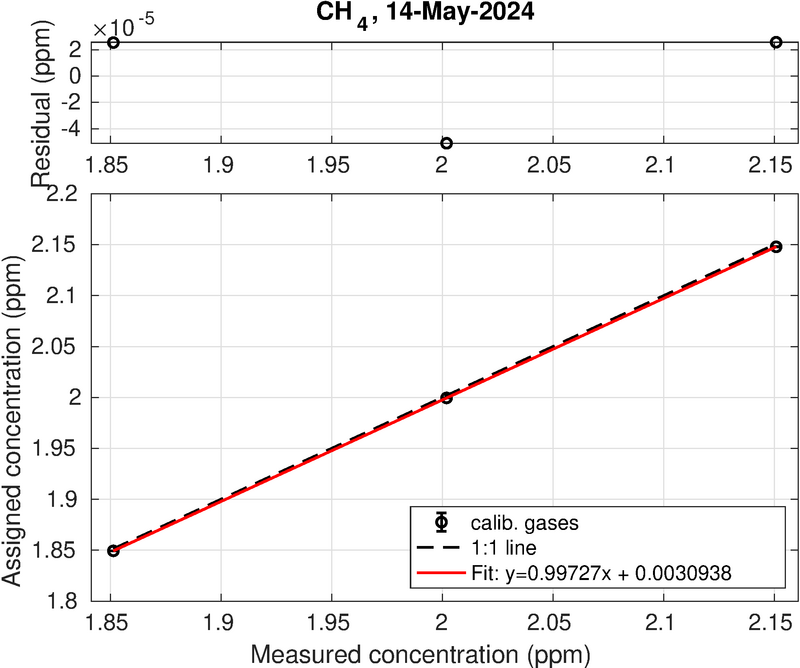
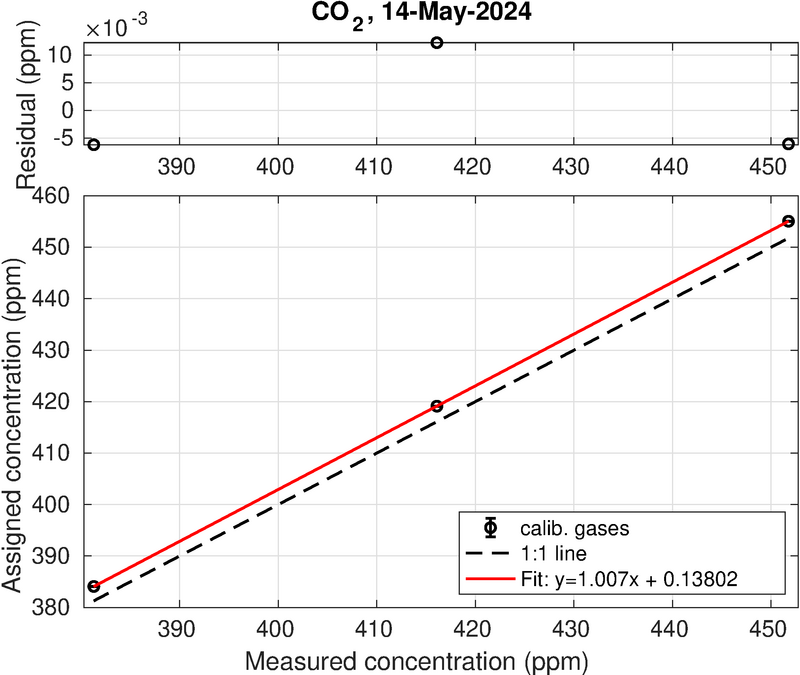
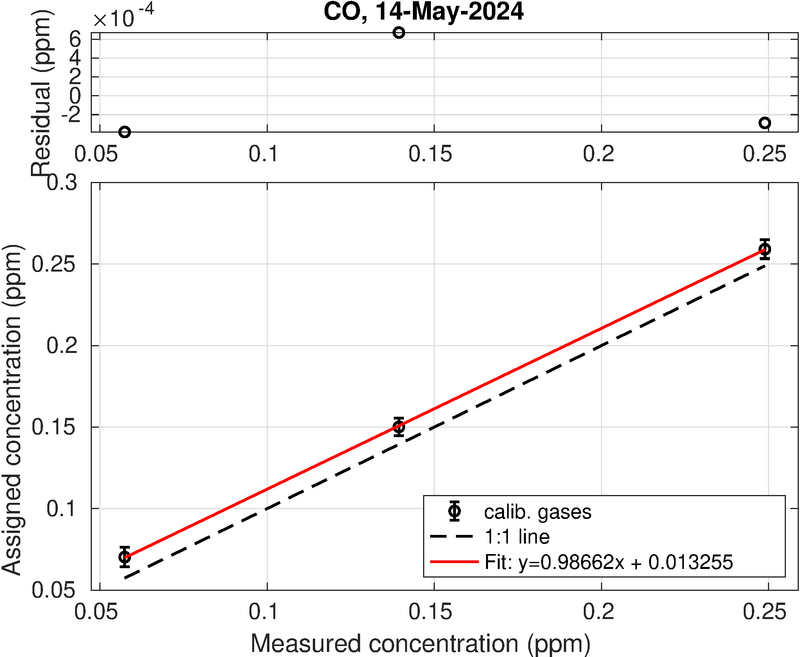
Previous succesful calibration.
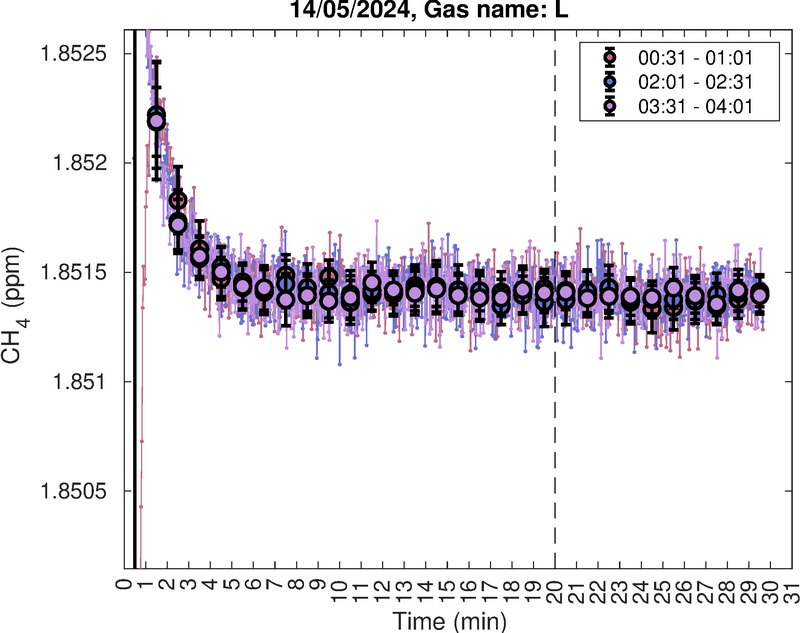
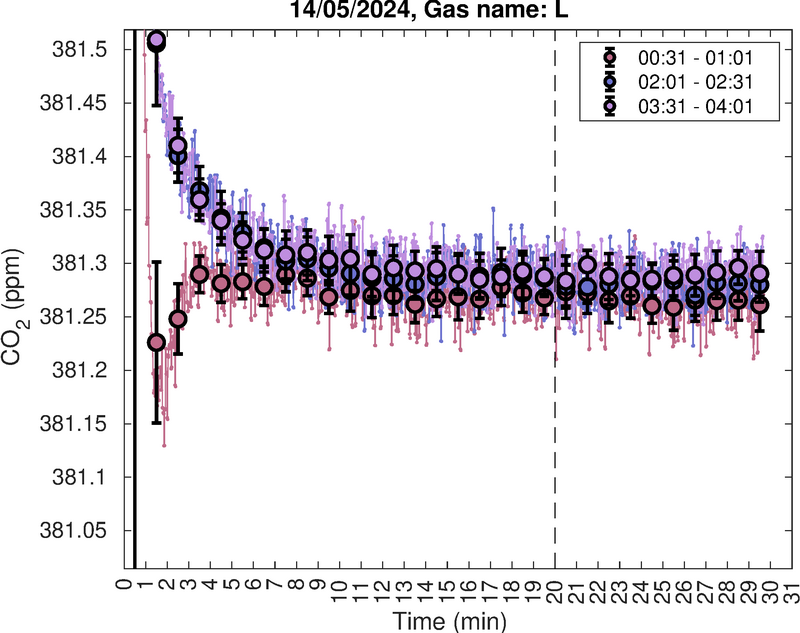
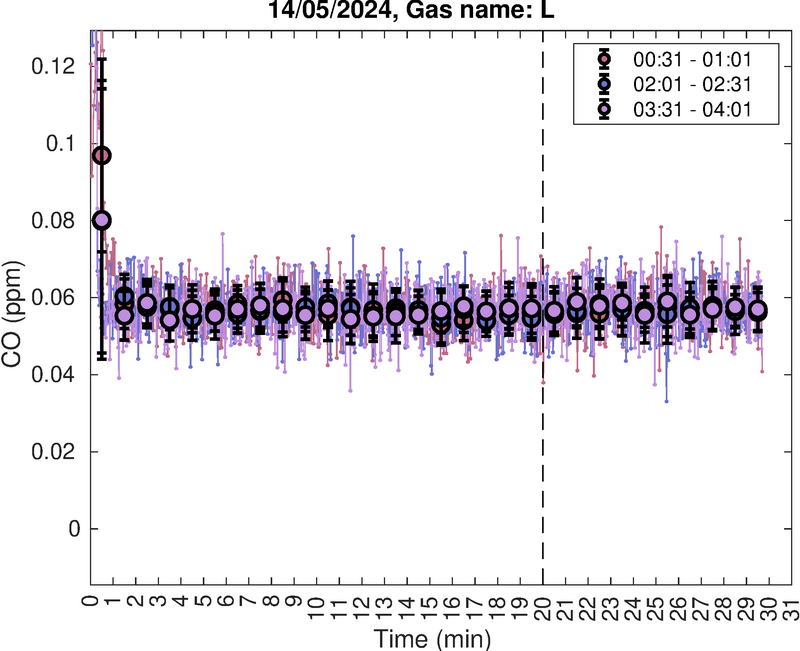
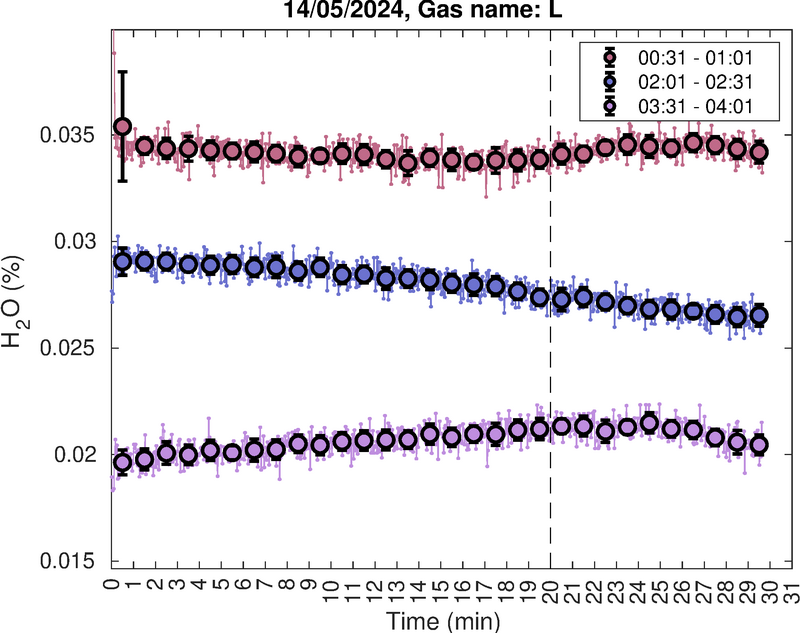
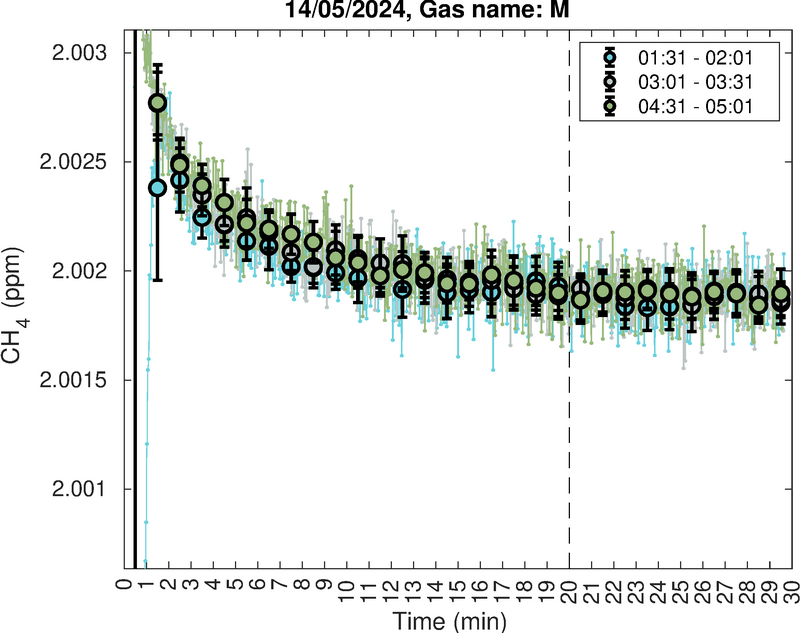
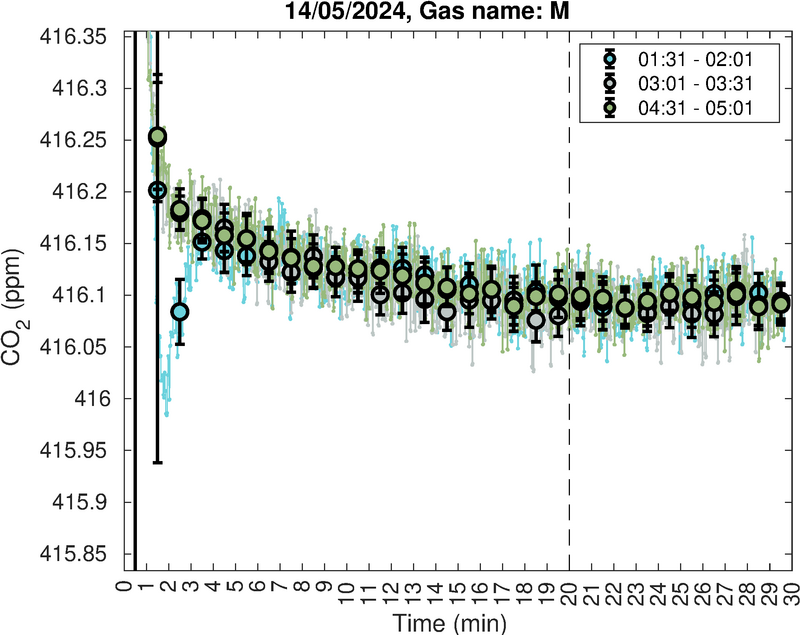
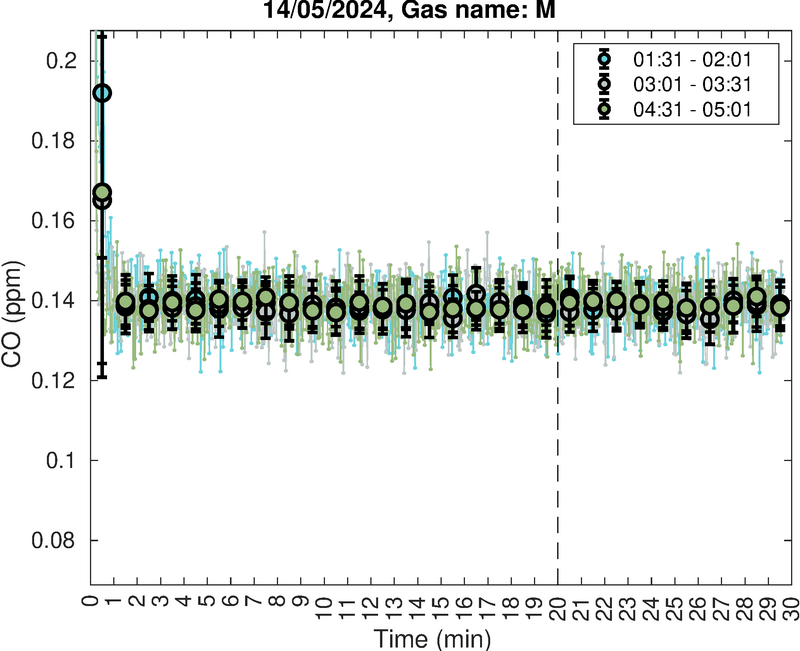
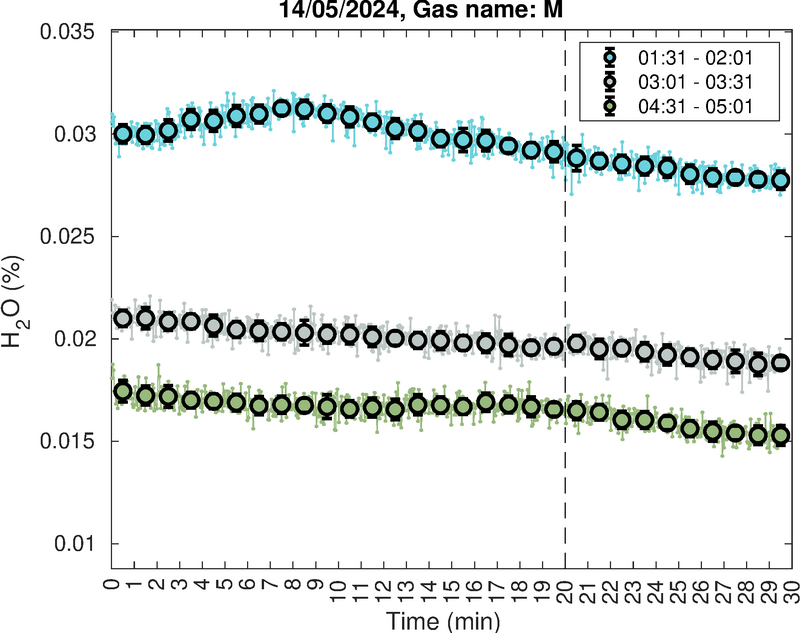
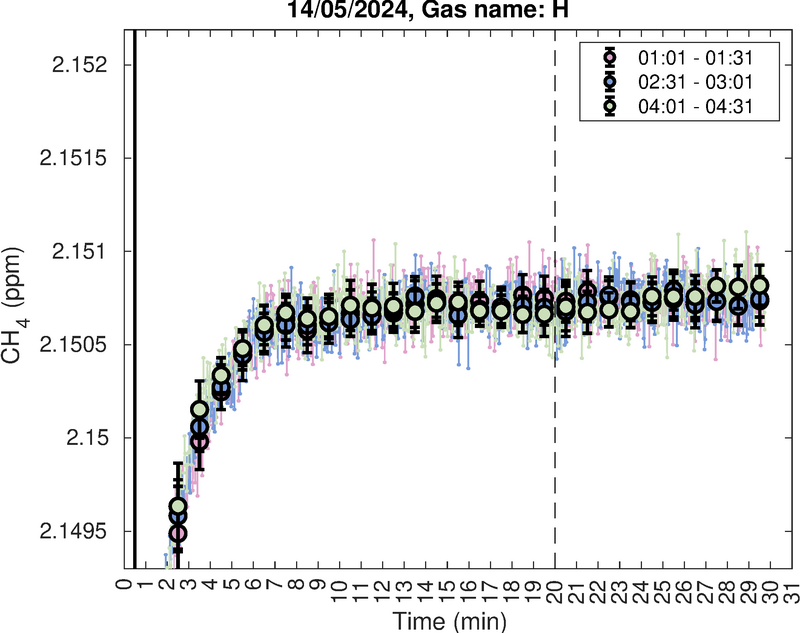
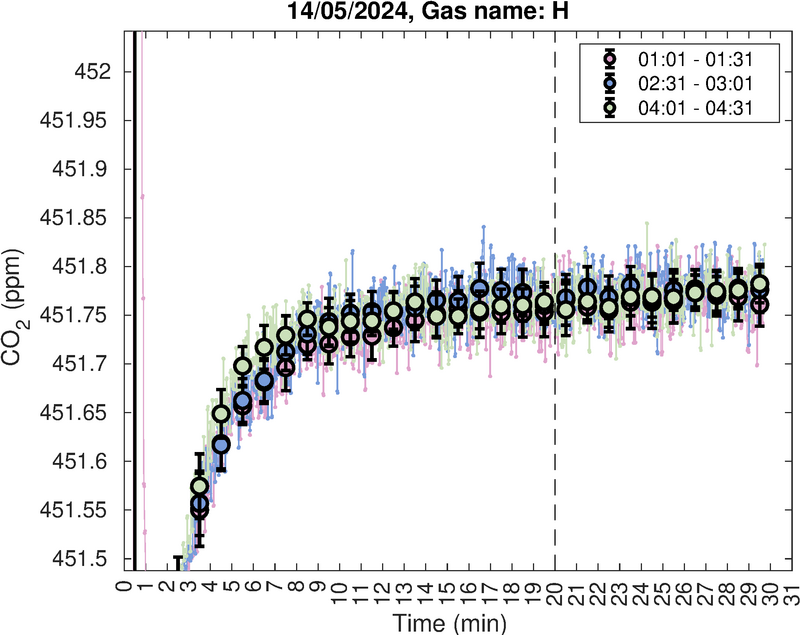
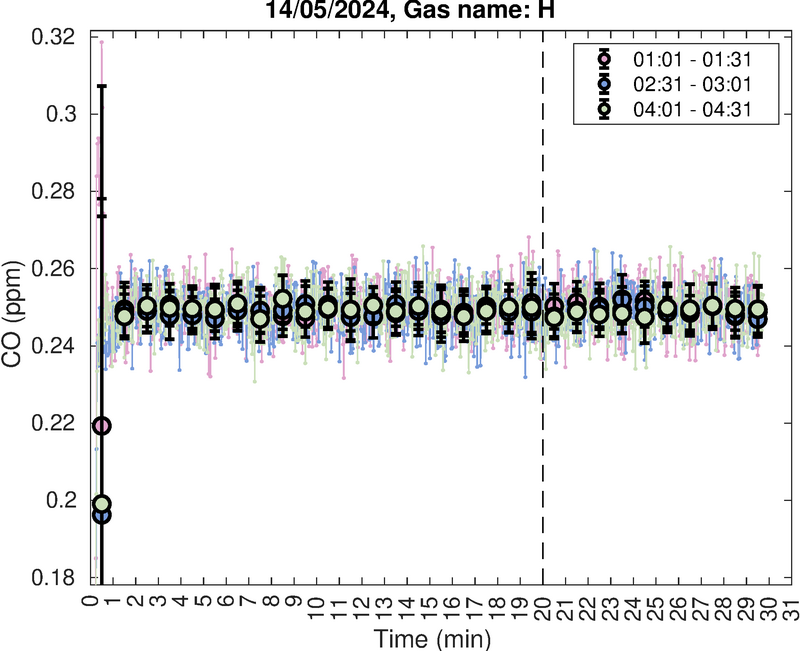
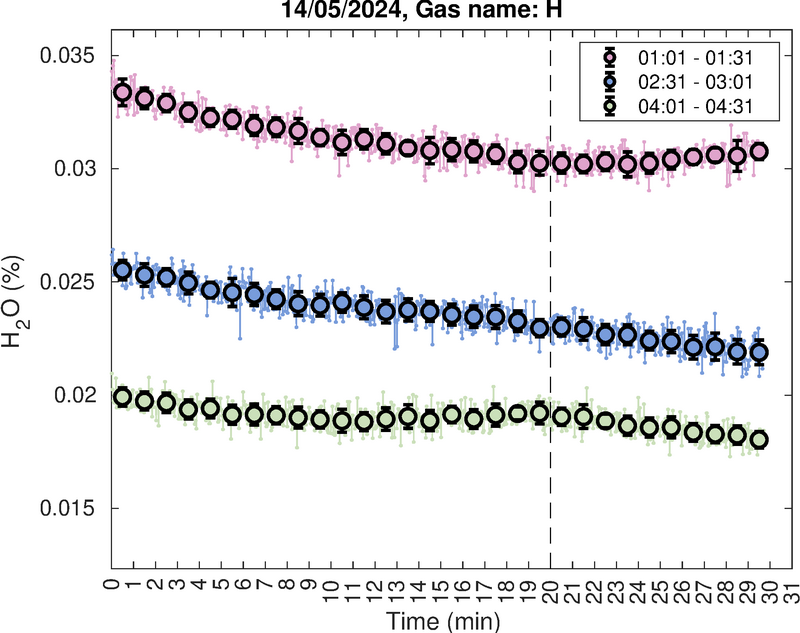
Previous successfull sampling periods of calibration gases L, M and H. Bold dots show 1 min means. For each of the 30 min sampling period, 20 min is reserved for flushing of the sample lines and the analyser, and then the last 10 min of the data are used to estimate the concentrations. The vertical dashded line indicates the 20 min time line.
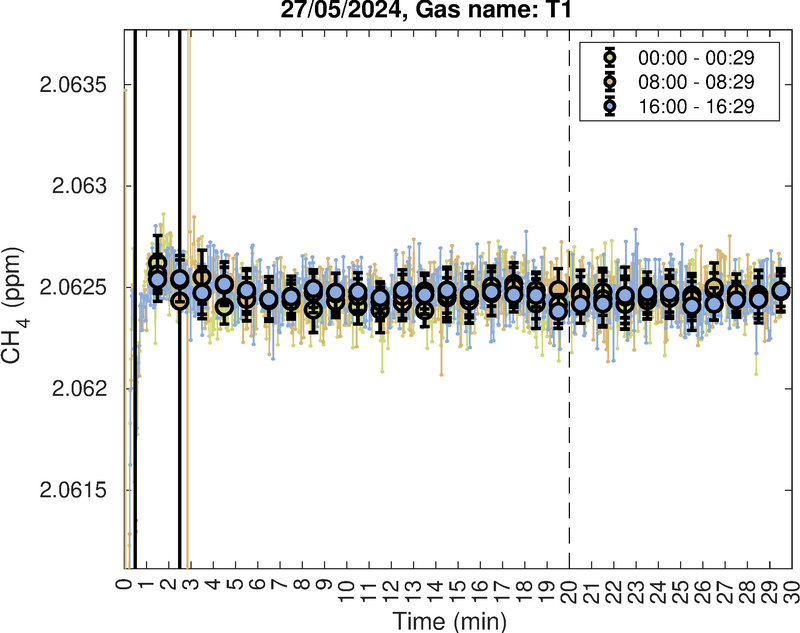
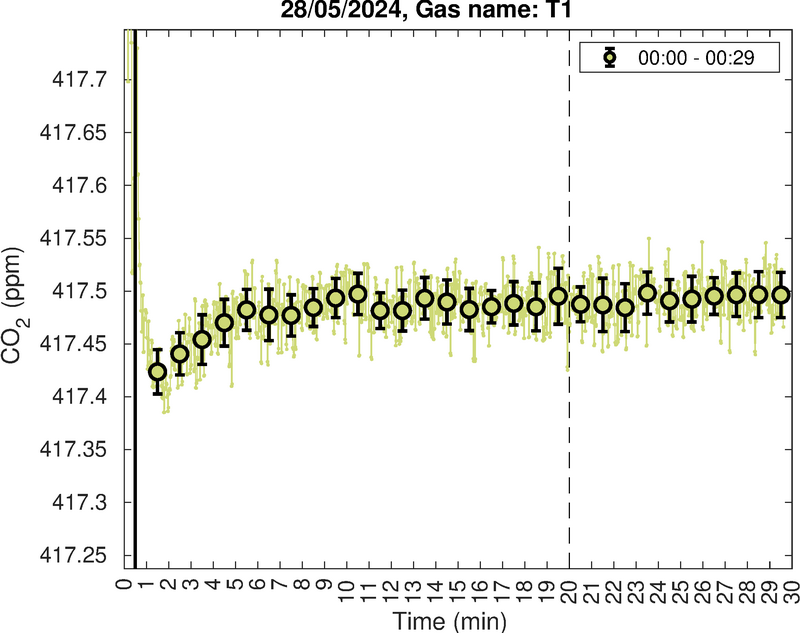
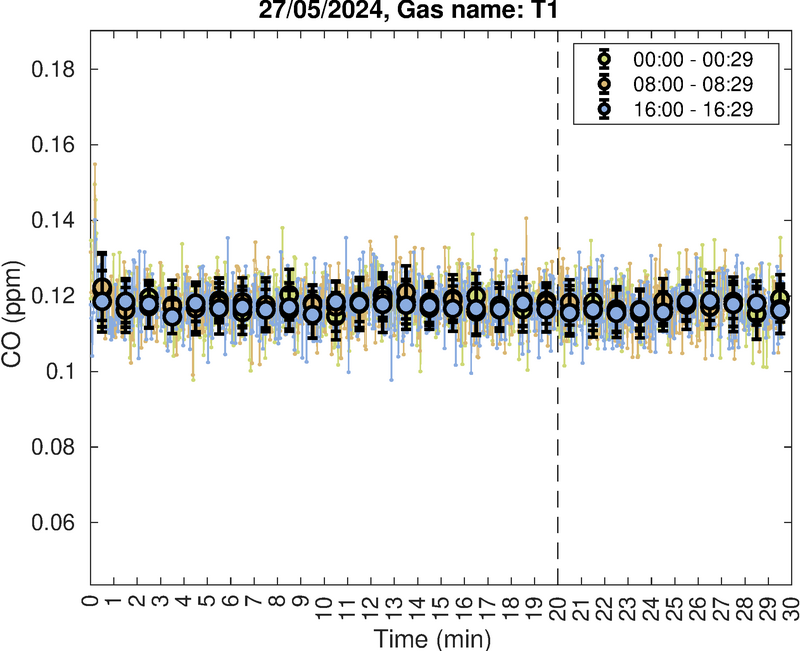
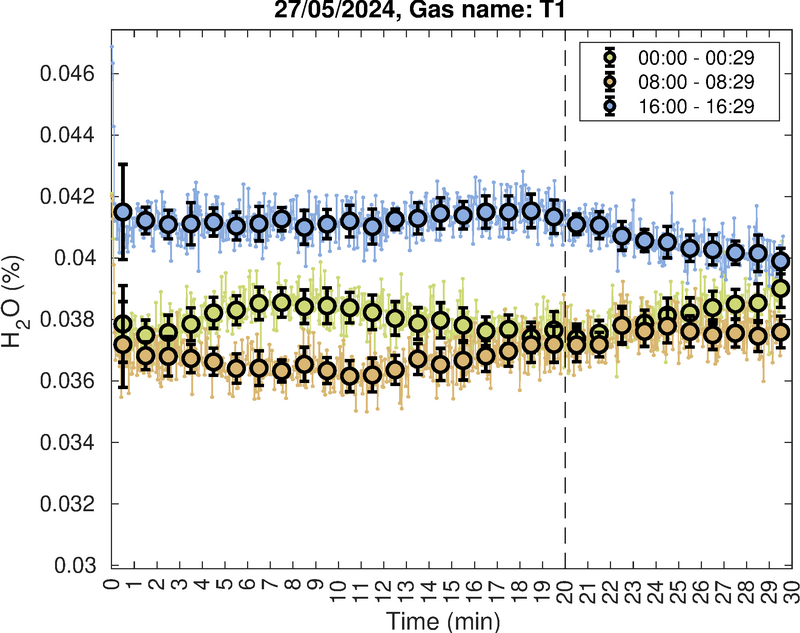
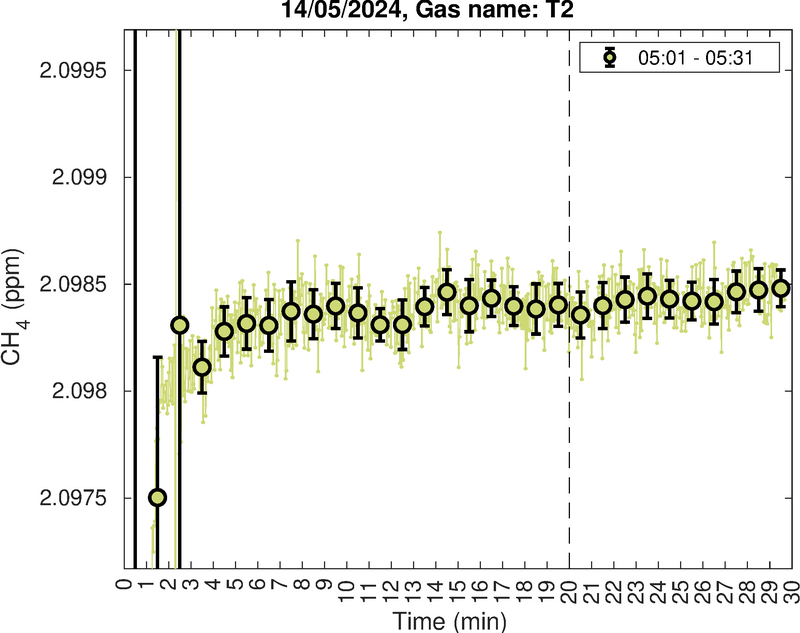
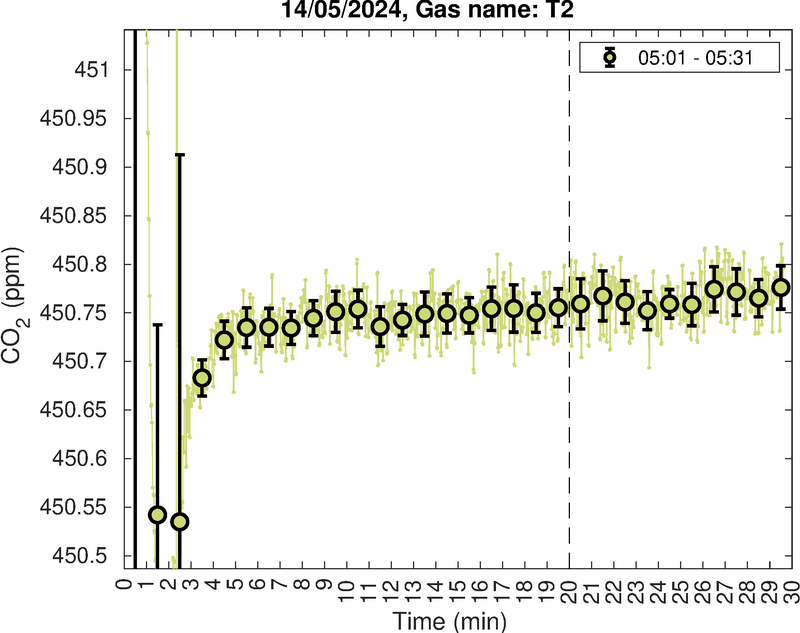
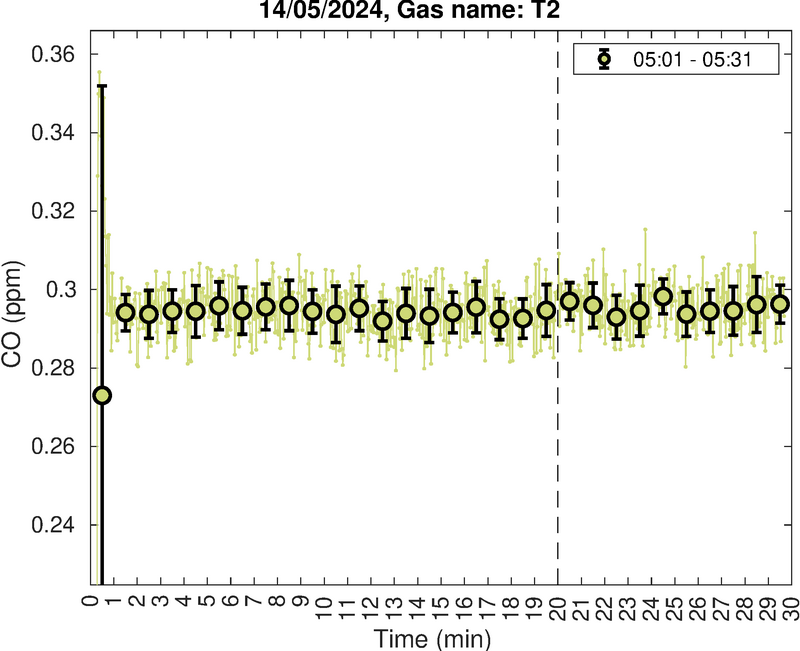
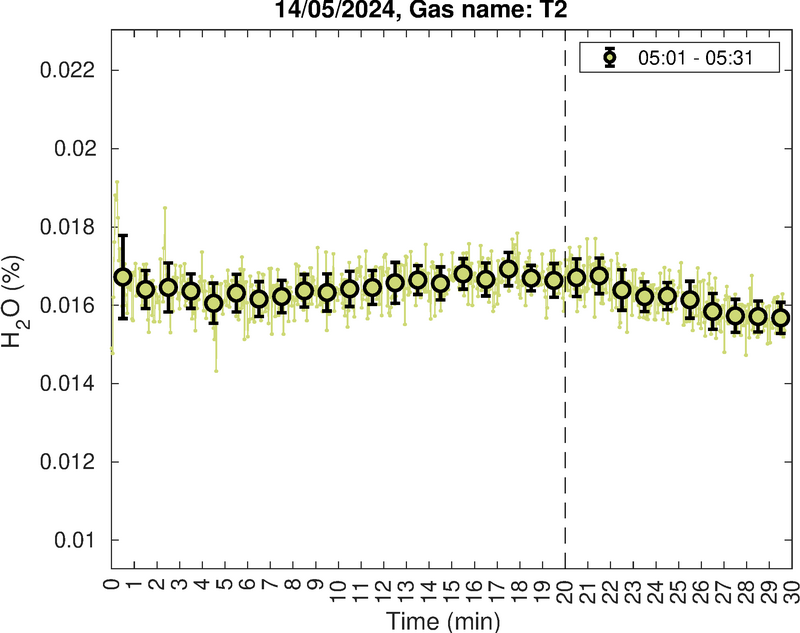
Previous successfull sampling periods of target gases T1 and T2. Bold dots show 1 min means. For each of the 30 min sampling period, 20 min is reserved for flushing of the sample lines and the analyser, and then the last 10 min of the data are used to estimate the concentrations. The vertical dashded line indicates the 20 min time line.