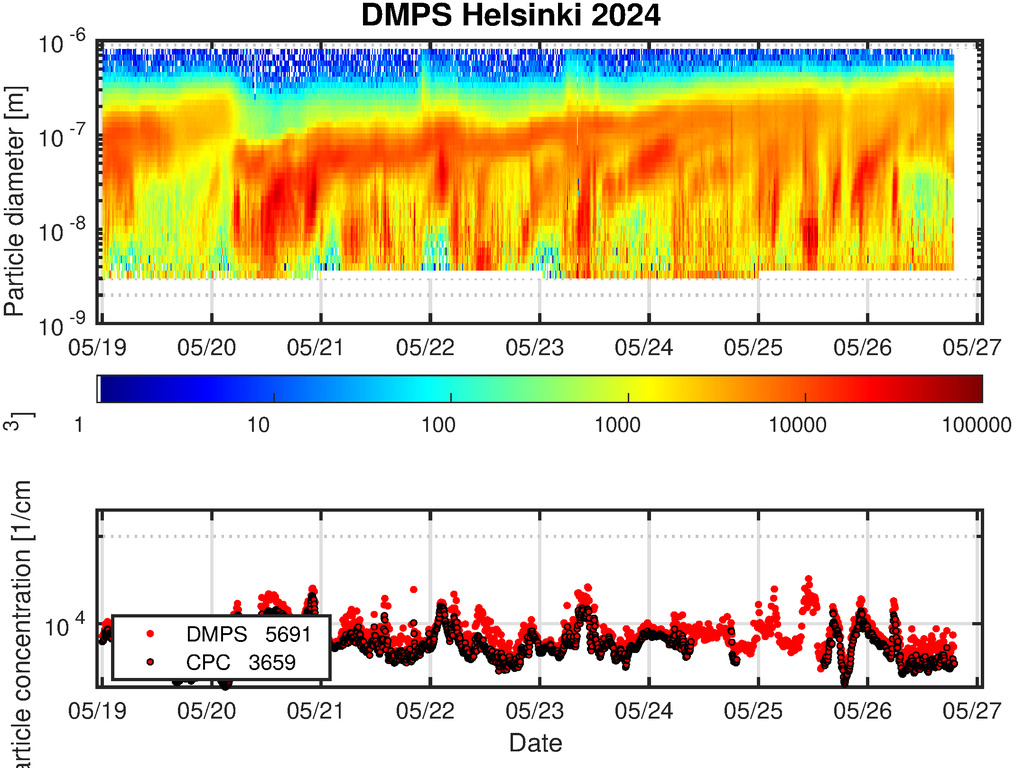
DMPS

Last modified by ppaalto@helsinki_fi on 2024/02/07 06:33

Particle size distributions are measured with Differential mobility particle sizers (DMPS). The instrument classifies the particles according to their electrical mobility, which is dependent on the particle size and charge. The first plot presents the particle number size distribution. Size is on the y-axis and time on the x-axis. Particle concentration is on the z-axis. The more red the colour is the more particles there exists in the given size class and time. Particles transported to the site further away have typically size around 100 nm or more. Particles produced locally by traffic have size between 10 and 100 nm. Particles produced locally in the near future by gas to particle formation have a diameter less than 10nm when they are "fresh". With time more material condense  on them and their size increases ("banana curve").

http://www.atm.helsinki.fi/pics/dmps_hesa.jpg

http://www.atm.helsinki.fi/pics/dmps_hesa_ratio.jpg

http://www.atm.helsinki.fi/pics/dmps_hesa_log4.jpg

http://www.atm.helsinki.fi/pics/dmps_hesa_log5.jpg

https://www.atm.helsinki.fi/pics/dmps_hesa_log1.png

https://www.atm.helsinki.fi/pics/dmps_hesa_log2.png

https://www.atm.helsinki.fi/pics/dmps_hesa_log3a.png

https://www.atm.helsinki.fi/pics/dmps_hesa_log3b.png

https://www.atm.helsinki.fi/pics/dmps_hesa_log3c.png

https://www.atm.helsinki.fi/pics/dmps_hesa_log1a.png

https://www.atm.helsinki.fi/pics/dmps_hesa_log2a.png

https://www.atm.helsinki.fi/pics/dmps_hesa_log3aa.png

https://www.atm.helsinki.fi/pics/dmps_hesa_log3ca.png

https://www.atm.helsinki.fi/pics/dmps_hesa_log3da.png

https://www.atm.helsinki.fi/pics/dmps_hesa_hvlog1.png

https://www.atm.helsinki.fi/pics/dmps_hesa_hvlog2.png