ICOS Ecosystem measurements

Last modified by Kira Ryhti-Laine on 2024/10/31 13:13

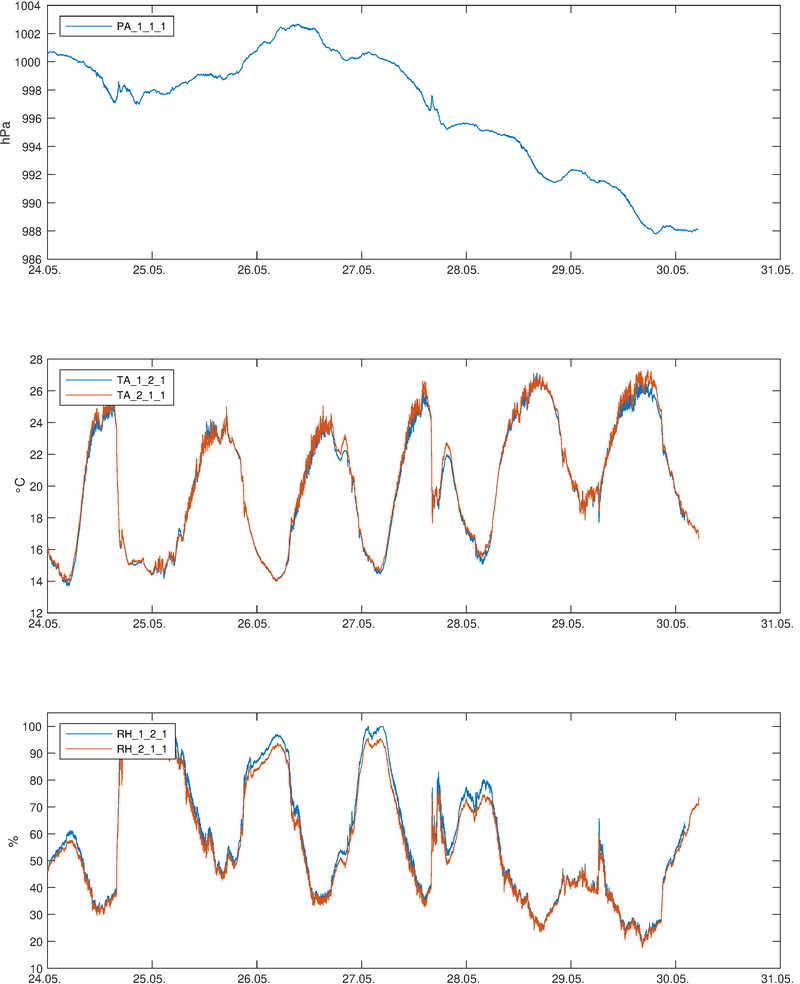
http://www.atm.helsinki.fi/pics/hyde_icos/hyde_meteo1.png

Atmospheric pressure at 30 m, air temperature and relative humidity
TA/RH_1 = mast 27 m, 2 = 35 m tower
http://www.atm.helsinki.fi/pics/hyde_icos/hyde_tprofile.png

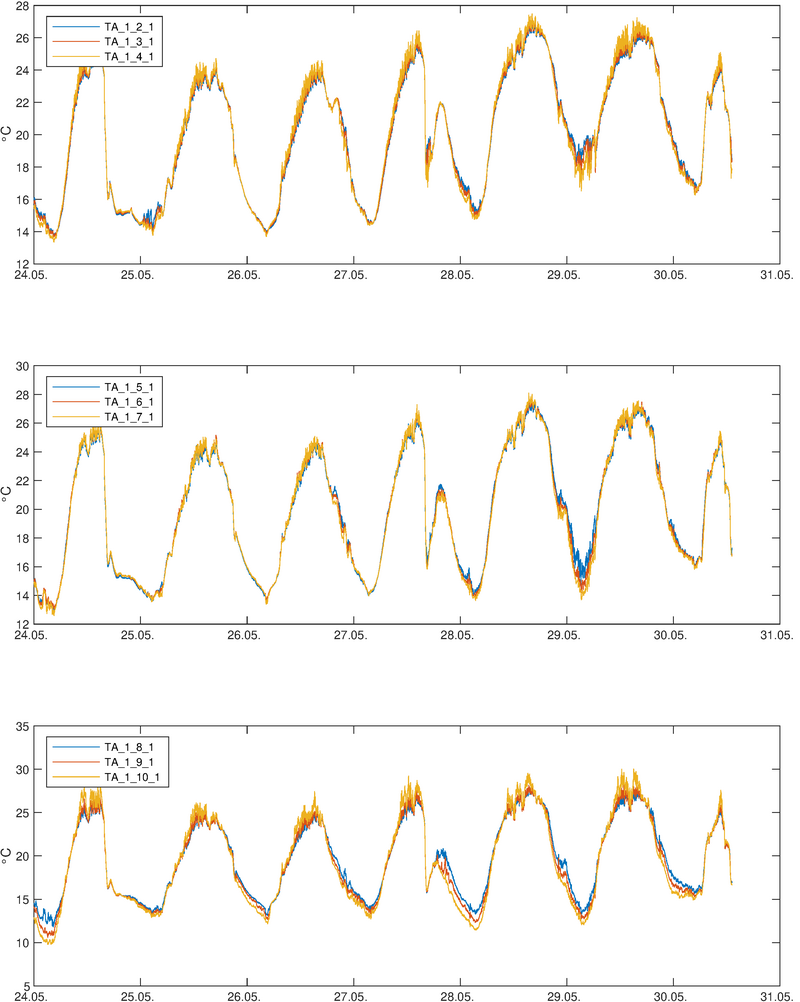
Air temperature profile
TA_1_2 = uppermost (27 m), TA_1_10 = lowest (0.4 m)
http://www.atm.helsinki.fi/pics/hyde_icos/hyde_rhprofile.png

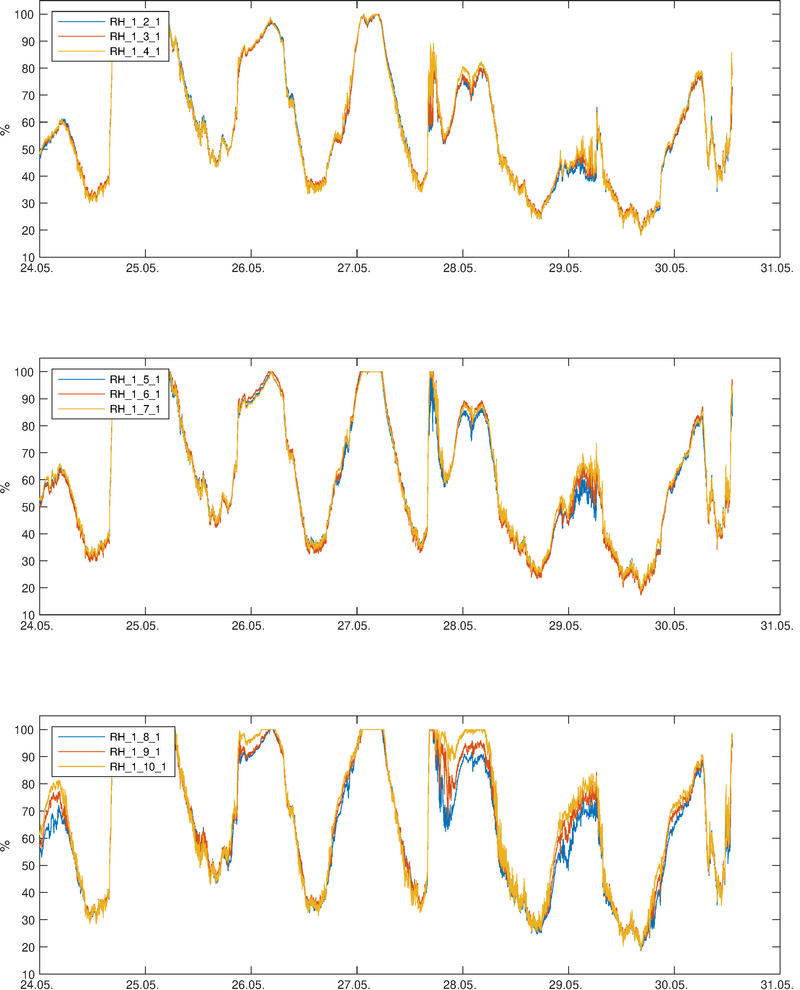
RH profile
RH_1_2 = uppermost (27 m), RH_1_10 = lowest (0.4 m)
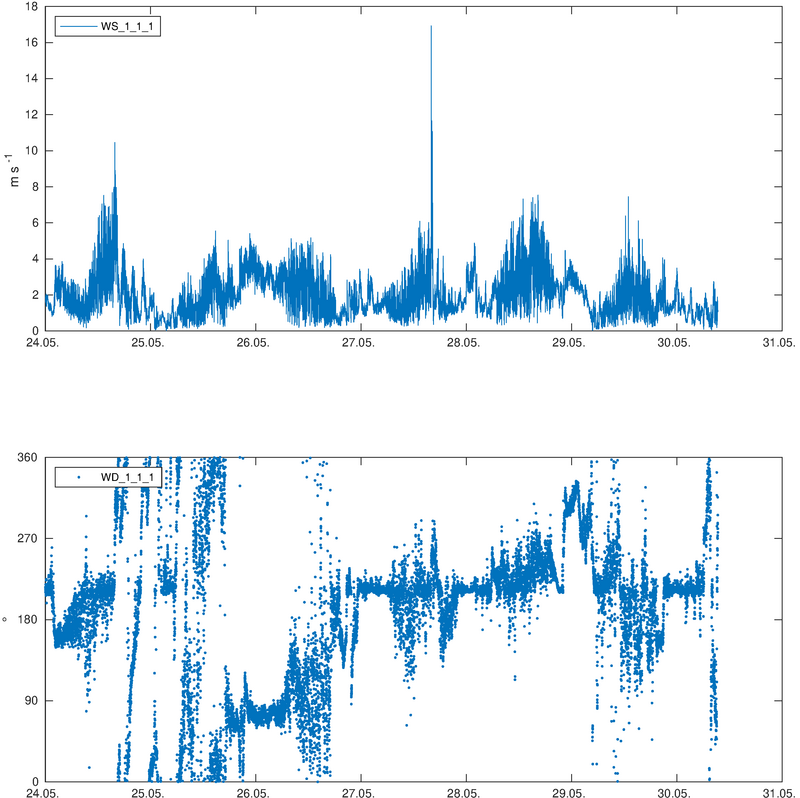
http://www.atm.helsinki.fi/pics/hyde_icos/hyde_meteo3.png

Wind speed and direction at 33 m

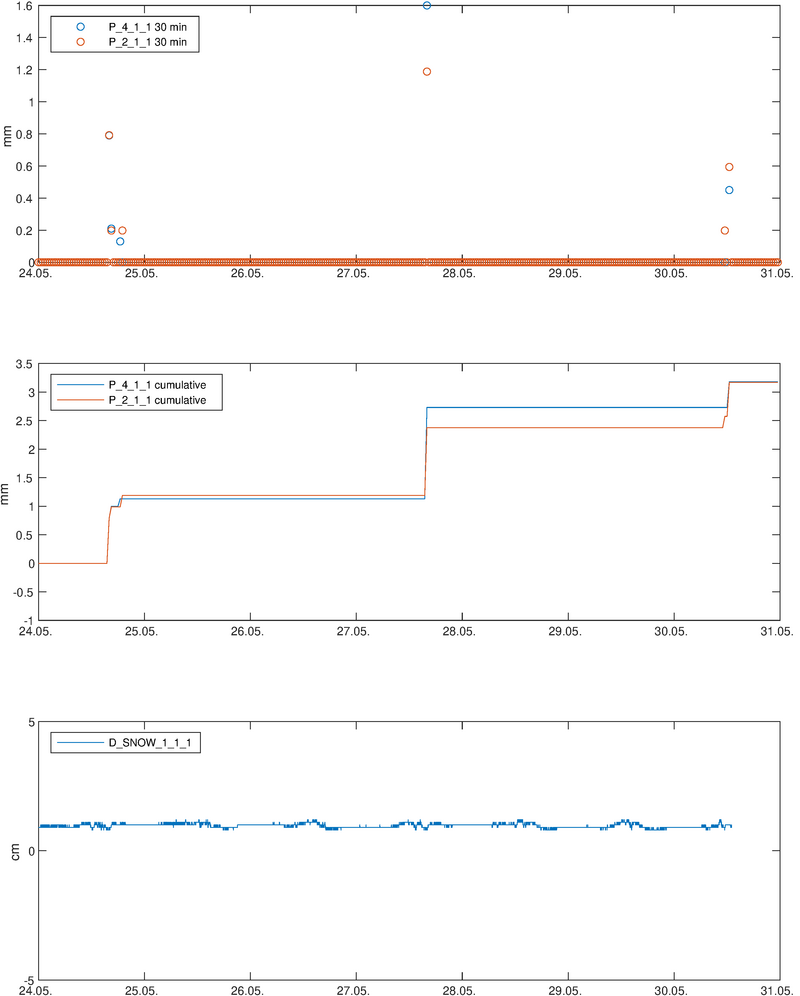
http://www.atm.helsinki.fi/pics/hyde_icos/hyde_meteo2.png

Precipitation and snow depth
P_4 = GPM Pluvio, P_2 = 35 m tower PWS ARG-100
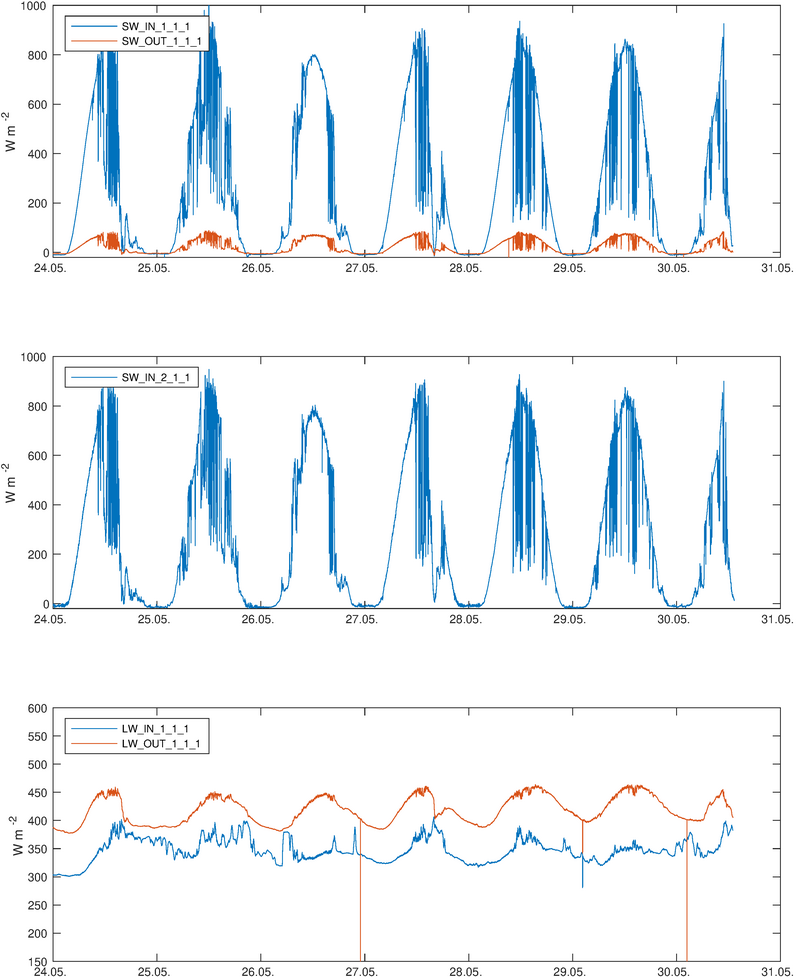
http://www.atm.helsinki.fi/pics/hyde_icos/hyde_radiation1.png

Solar and terrestrial radiation
SW/LW_1 = 67 m CNR4, 2 = 35 m tower pyranometer
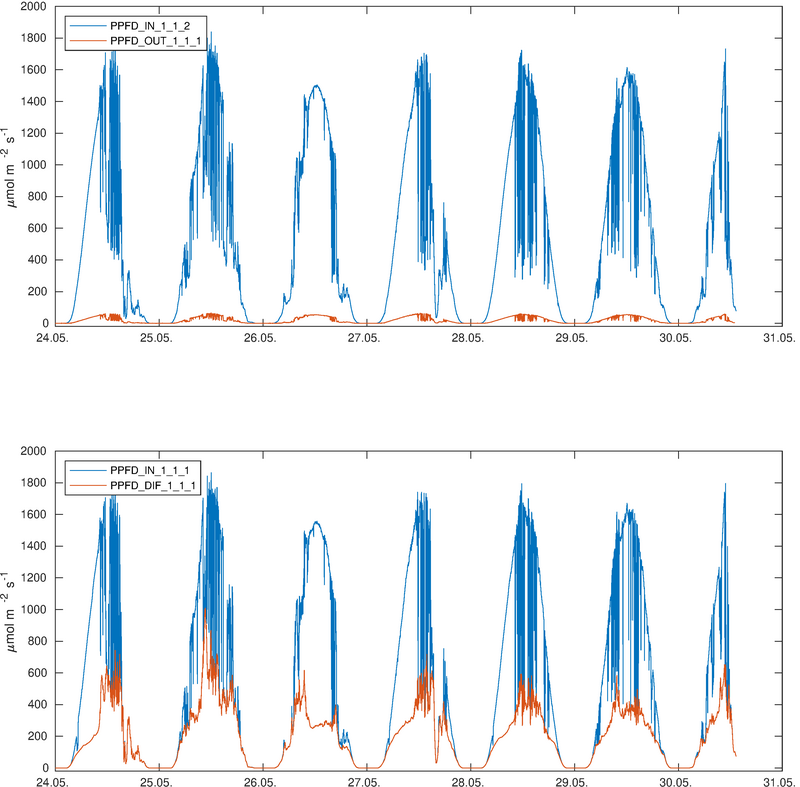
http://www.atm.helsinki.fi/pics/hyde_icos/hyde_radiation2.png

Solar and terrestrial radiation
upper panel: 35 m tower Li-190 and mast reflected Li-190; lower panel: 35 m tower Delta BF5
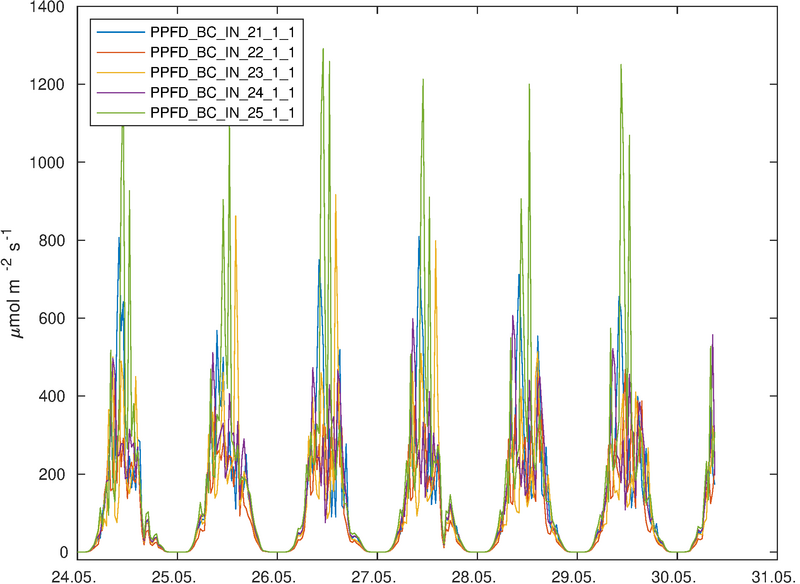
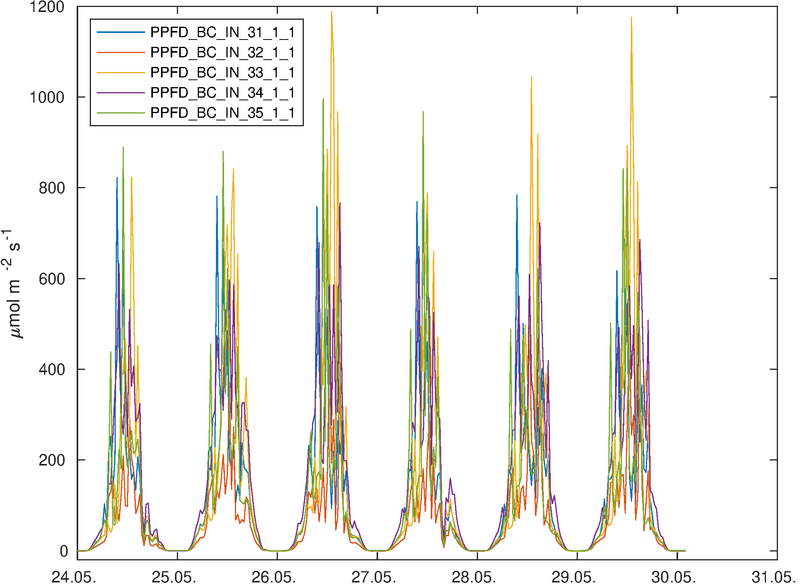
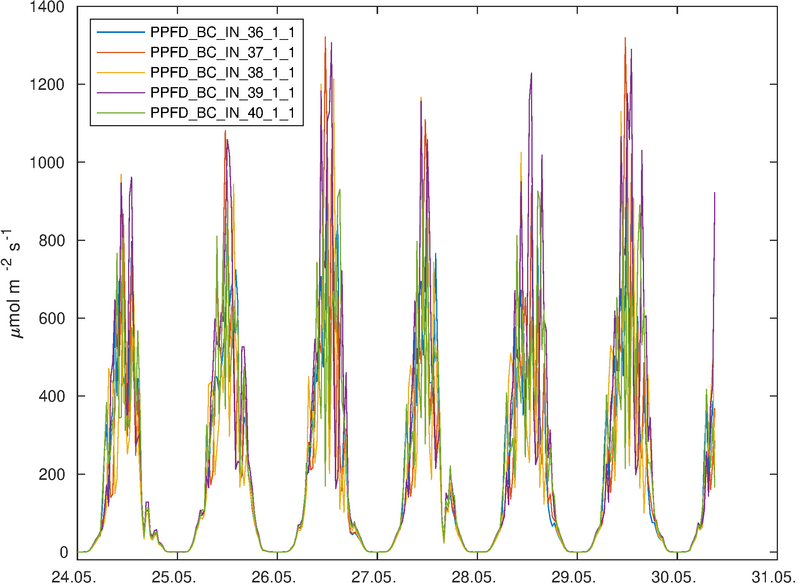
http://www.atm.helsinki.fi/pics/hyde_icos/hyde_radiation_plot1.png

http://www.atm.helsinki.fi/pics/hyde_icos/hyde_radiation_plot2.png

http://www.atm.helsinki.fi/pics/hyde_icos/hyde_radiation_plot3.png

http://www.atm.helsinki.fi/pics/hyde_icos/hyde_radiation_plot4.png

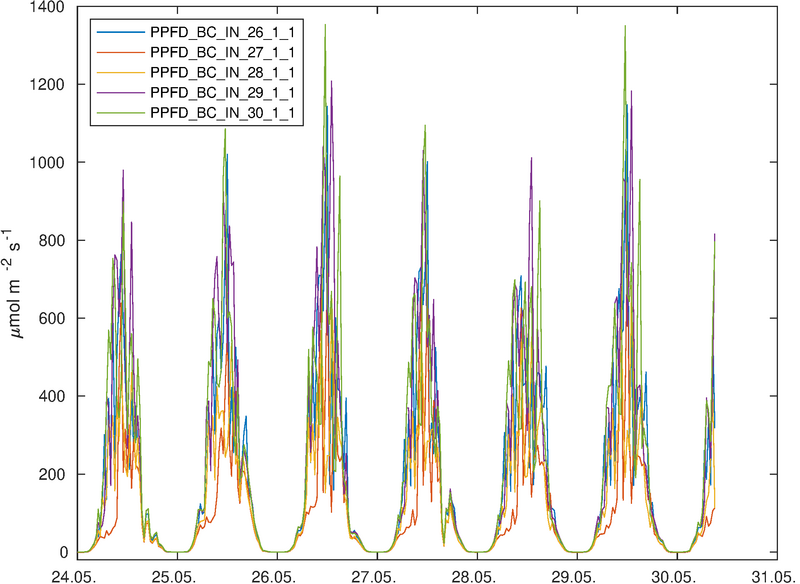
Half-hourly averaged below-canopy PAR at continuous sampling plots (5 sensors per plot)

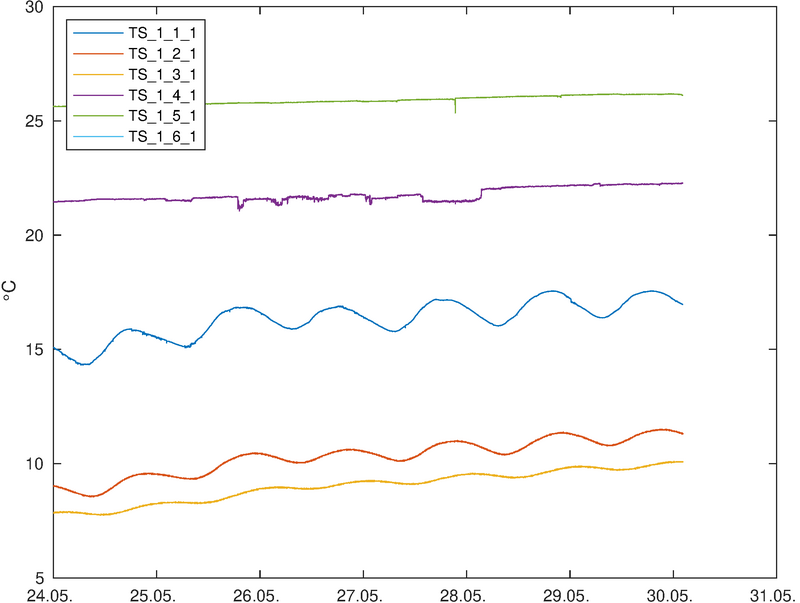
http://www.atm.helsinki.fi/pics/hyde_icos/hyde_tsoil1.png

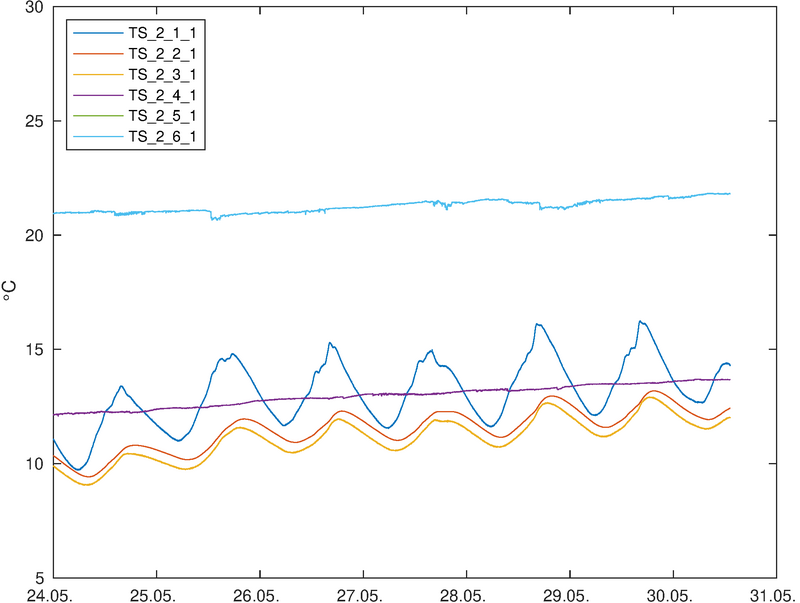
http://www.atm.helsinki.fi/pics/hyde_icos/hyde_tsoil2.png

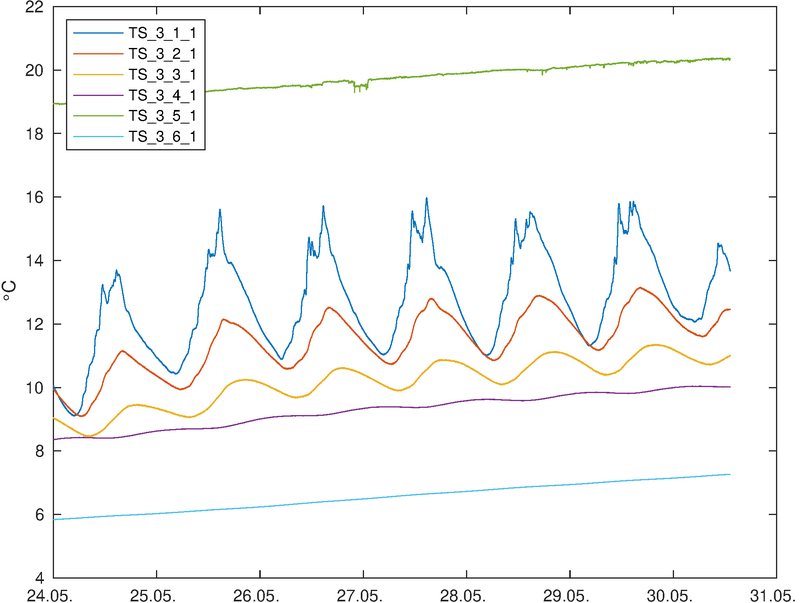
http://www.atm.helsinki.fi/pics/hyde_icos/hyde_tsoil3.png

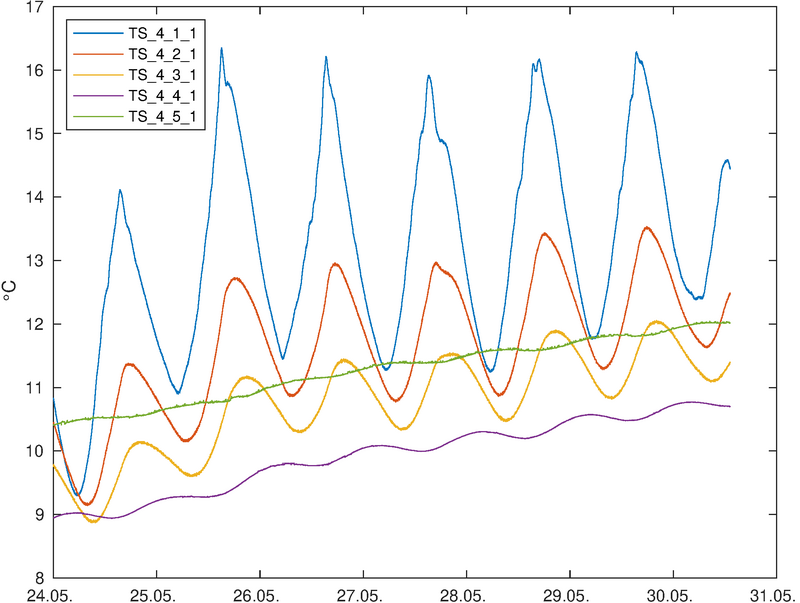
http://www.atm.helsinki.fi/pics/hyde_icos/hyde_tsoil4.png

Soil temperature at 0, 5, 10, 30, 50, 75 cm depths at soil plots 1...4
http://www.atm.helsinki.fi/pics/hyde_icos/hyde_wsoil1.png

http://www.atm.helsinki.fi/pics/hyde_icos/hyde_wsoil2.png

http://www.atm.helsinki.fi/pics/hyde_icos/hyde_wsoil3.png

http://www.atm.helsinki.fi/pics/hyde_icos/hyde_wsoil4.png

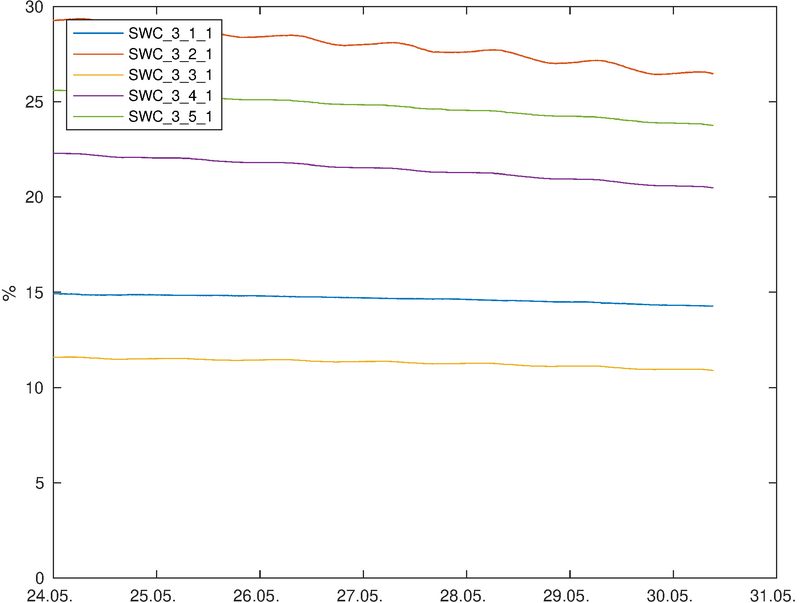
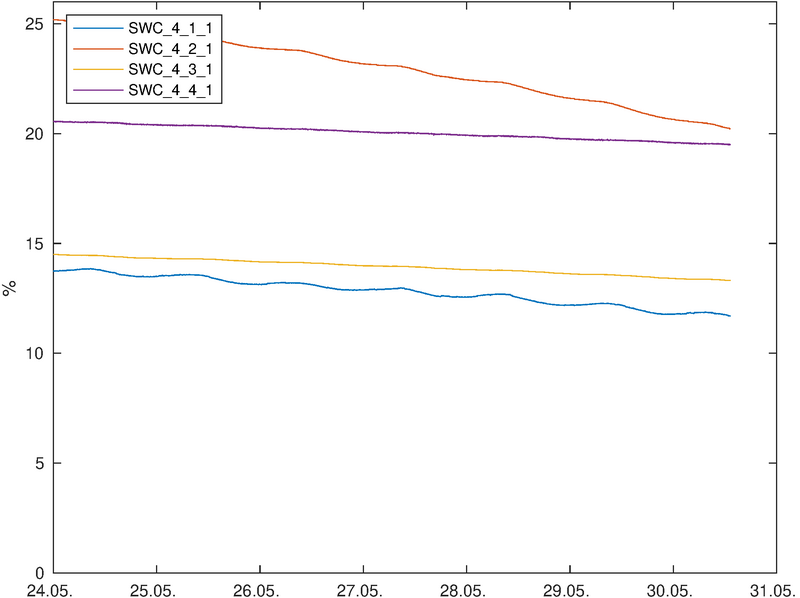
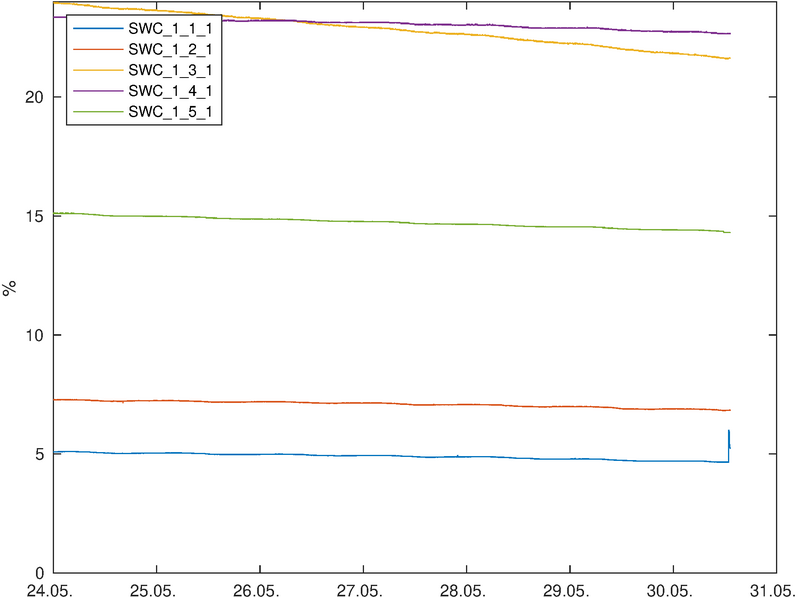
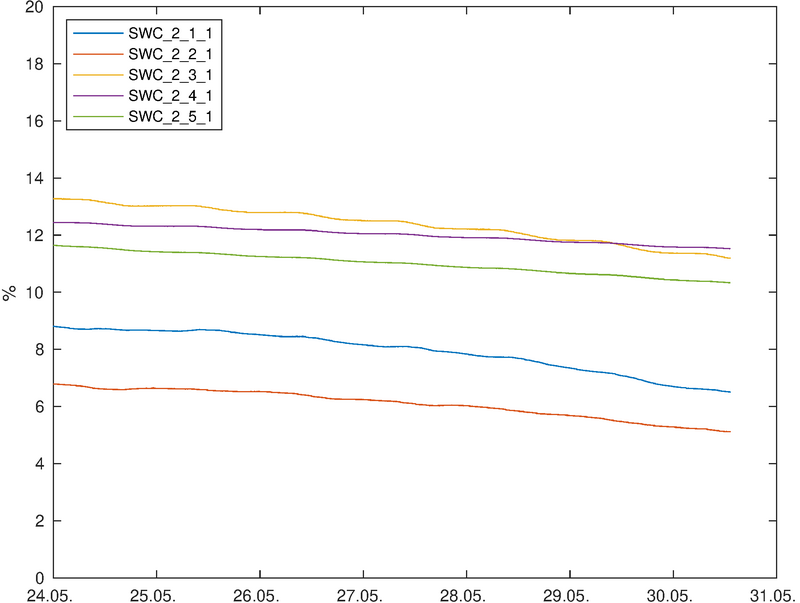
Soil volumetric water content at 5, 10, 30, 50, 75 cm depths at soil plots 1...4
http://www.atm.helsinki.fi/pics/hyde_icos/hyde_g.png

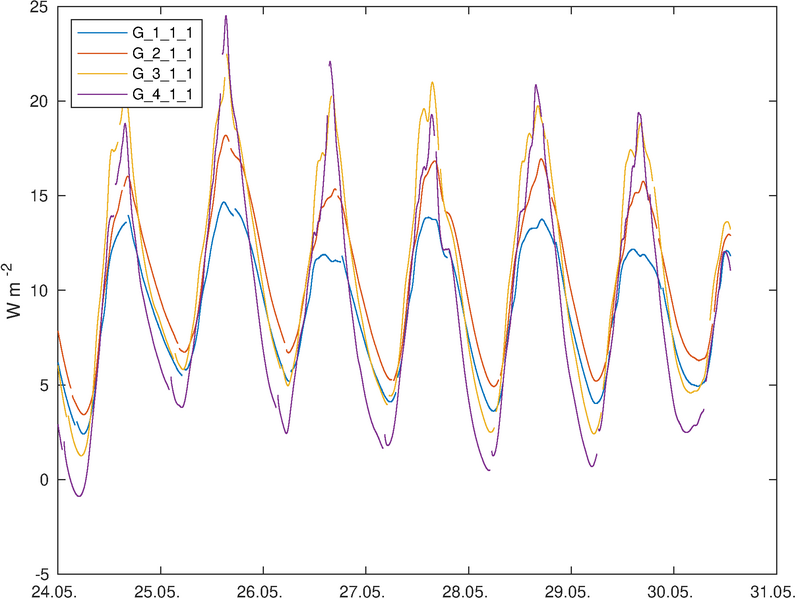
Ground heat flux at soil plots 1...4
https://www.atm.helsinki.fi/pics/hyde_icos/FI-Hyy_dendrom_plot1.png

https://www.atm.helsinki.fi/pics/hyde_icos/FI-Hyy_dendrom_plot2.png

https://www.atm.helsinki.fi/pics/hyde_icos/FI-Hyy_dendrom_plot3.png

https://www.atm.helsinki.fi/pics/hyde_icos/FI-Hyy_dendrom_plot4.png

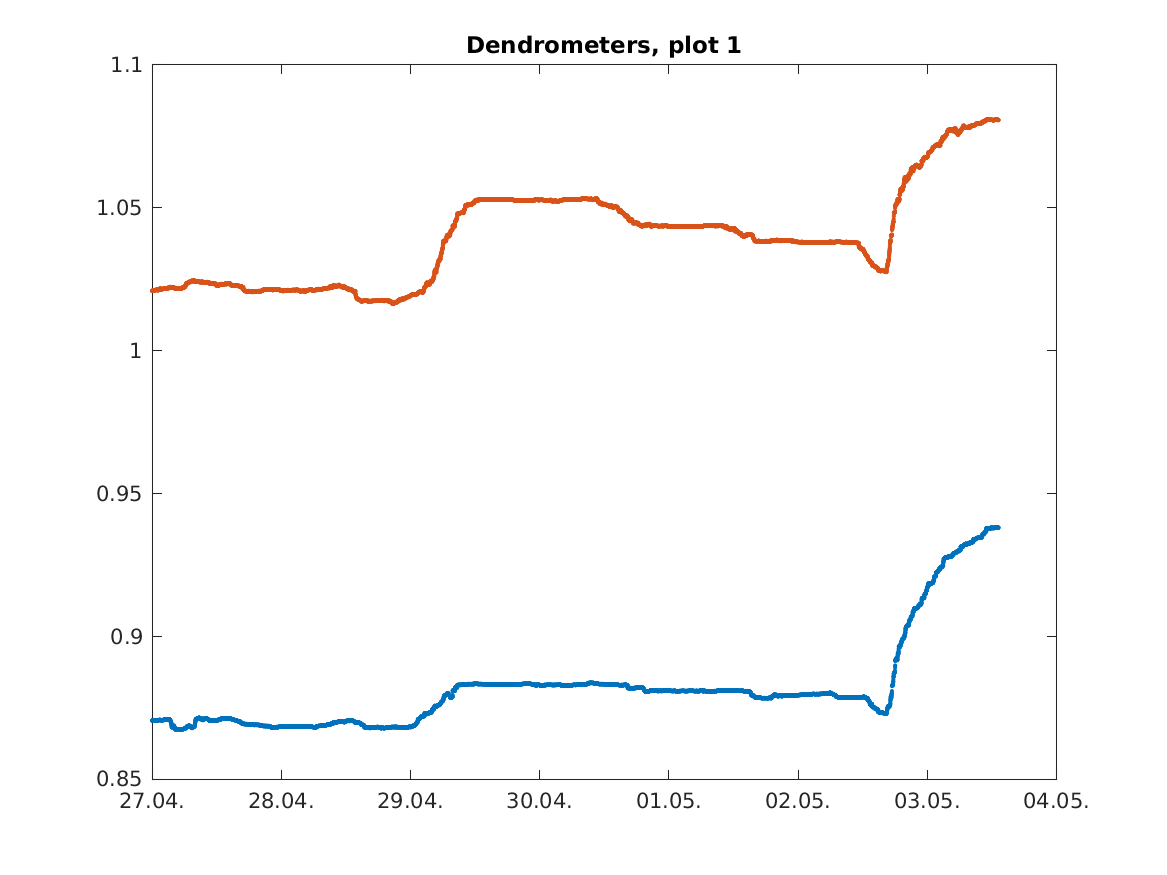
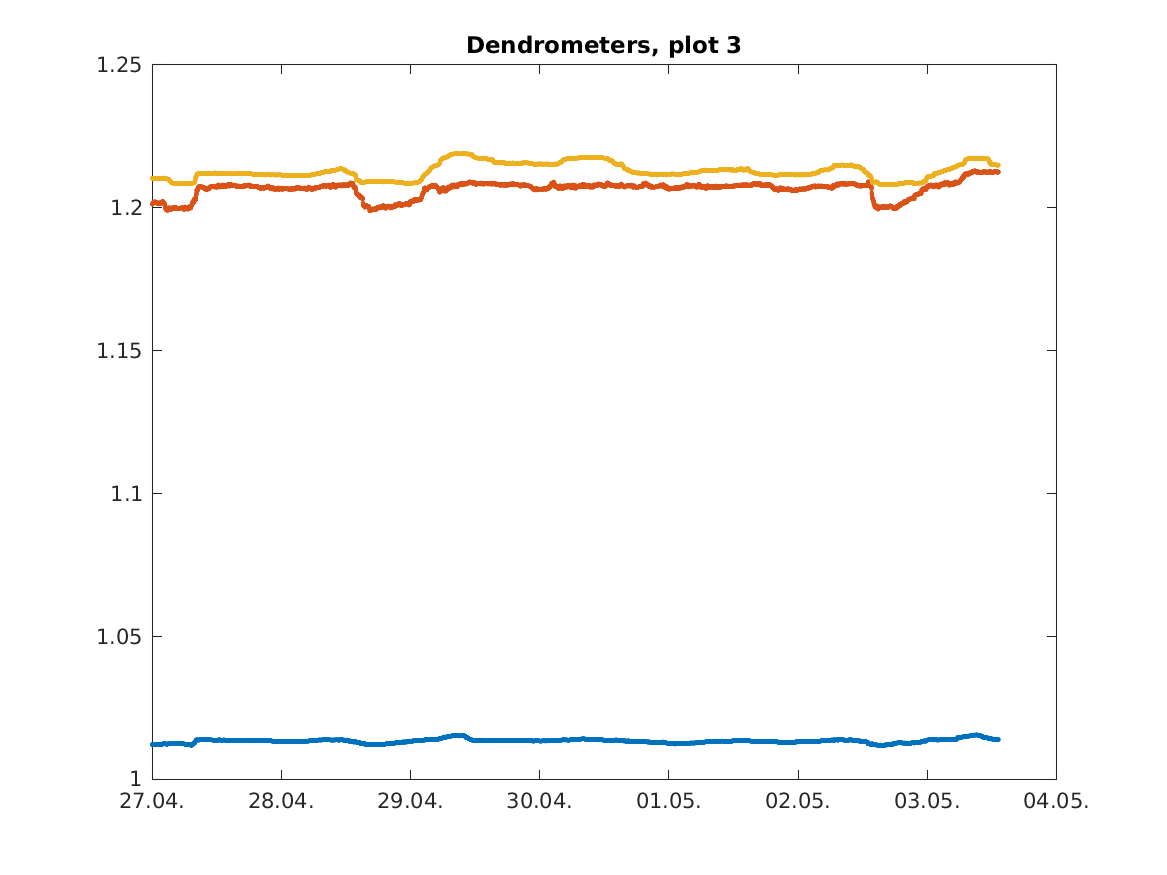
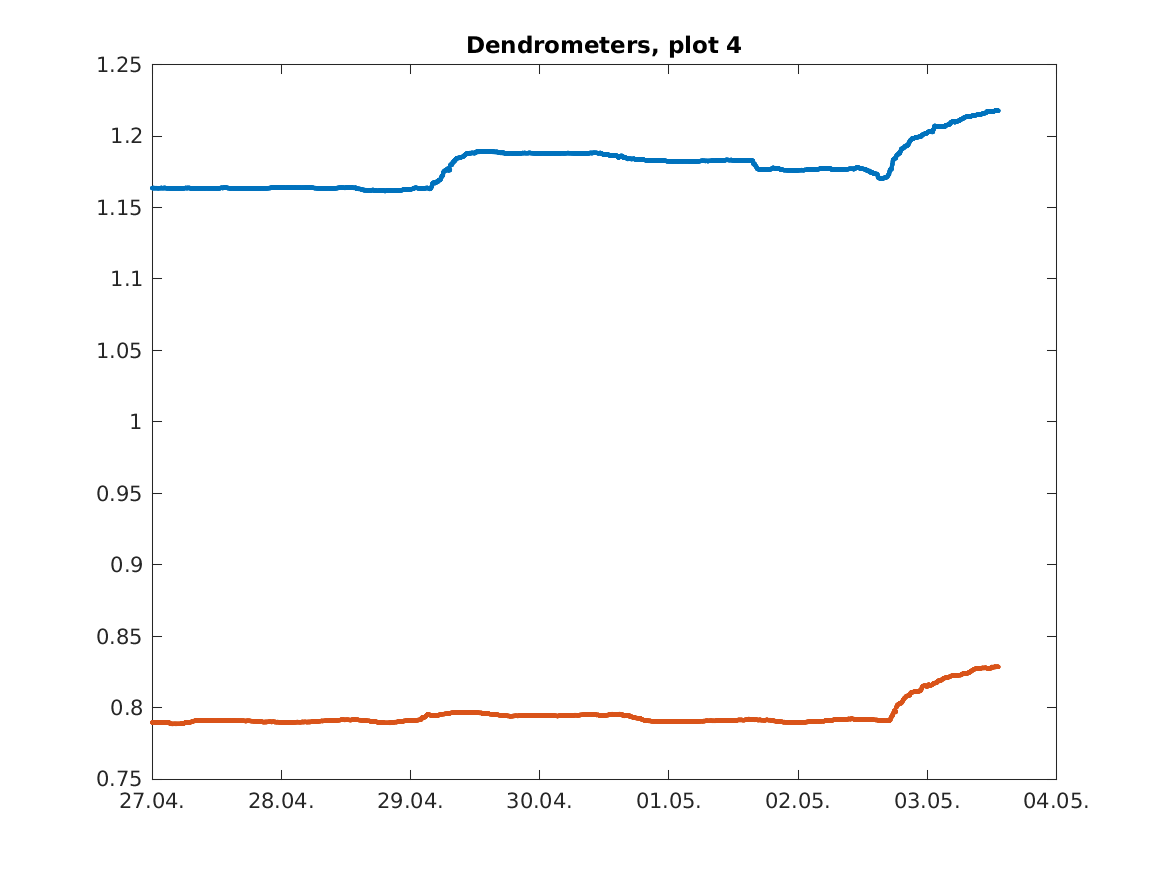
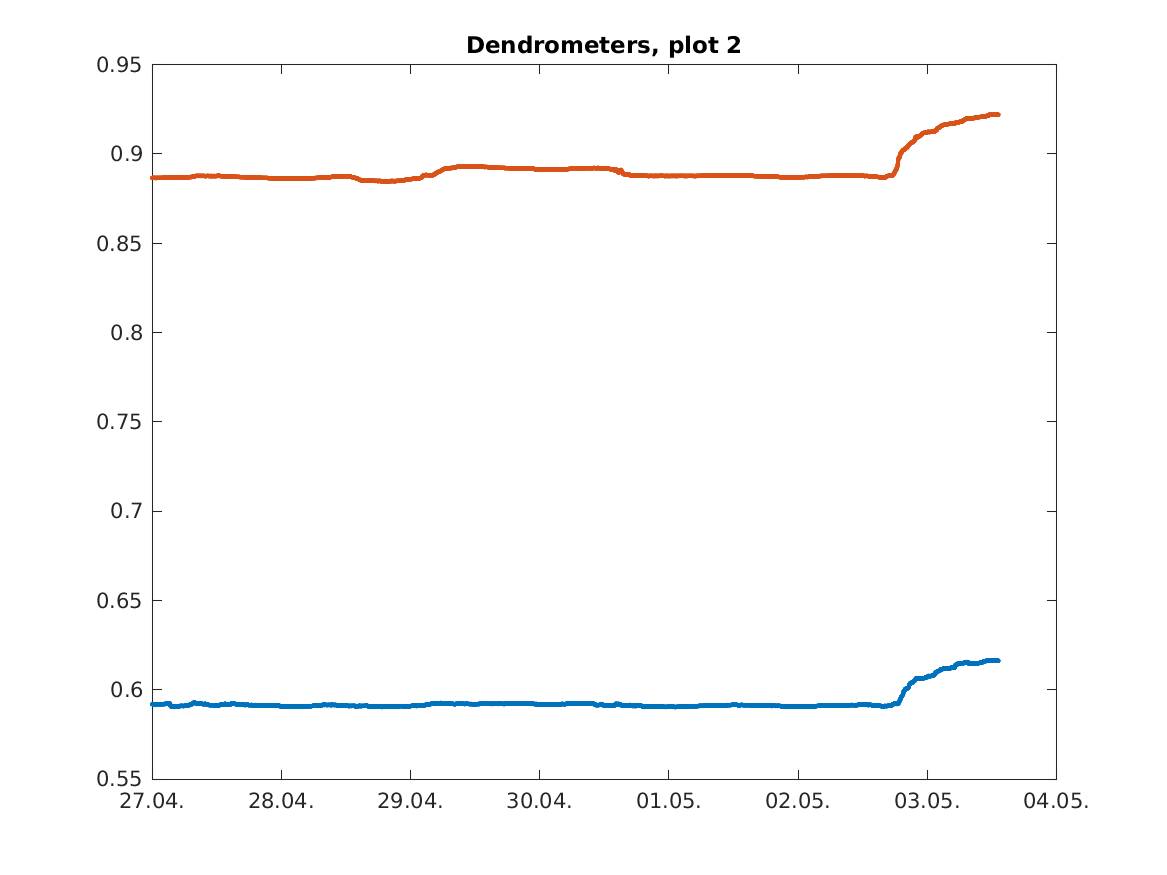
Dendrometers at soil plots 1...4, blue=1, orange=2, yellow=3
IN TEST USE, y axis in Vhelp