ICOS EC storage measurement
Last modified by Pasi Kolari on 2025/06/09 07:57
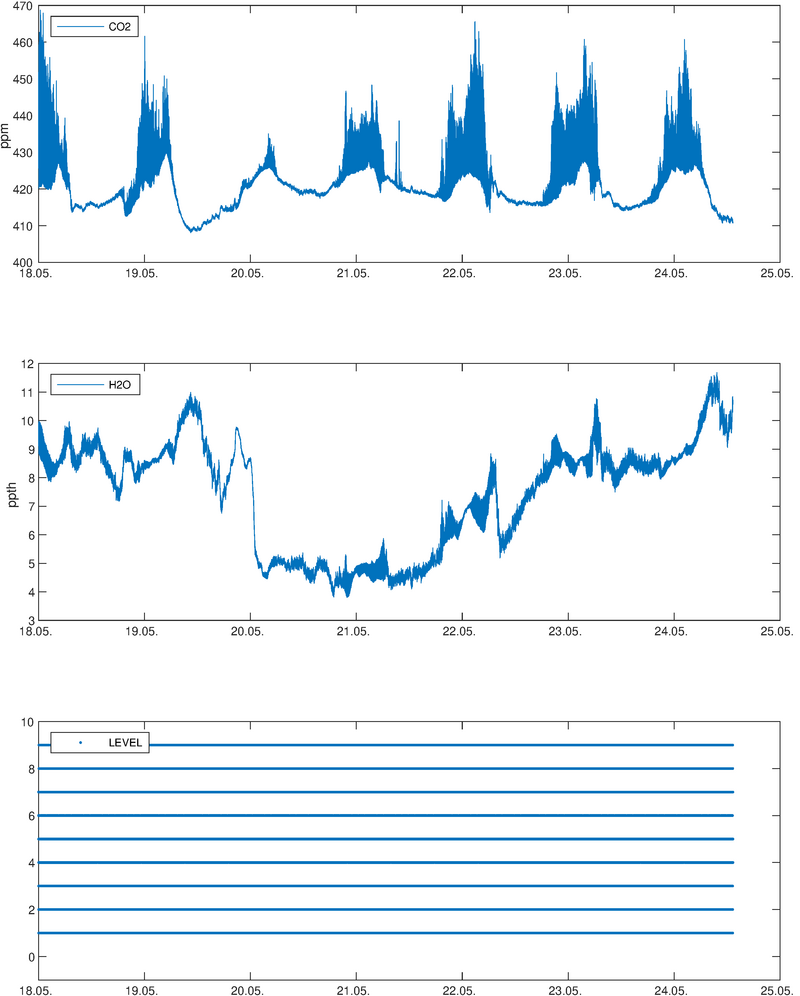
CO2 and H2O storage measurement,
raw gas concentration data and sampling levels (valid values 1...9, 0=invalid value).
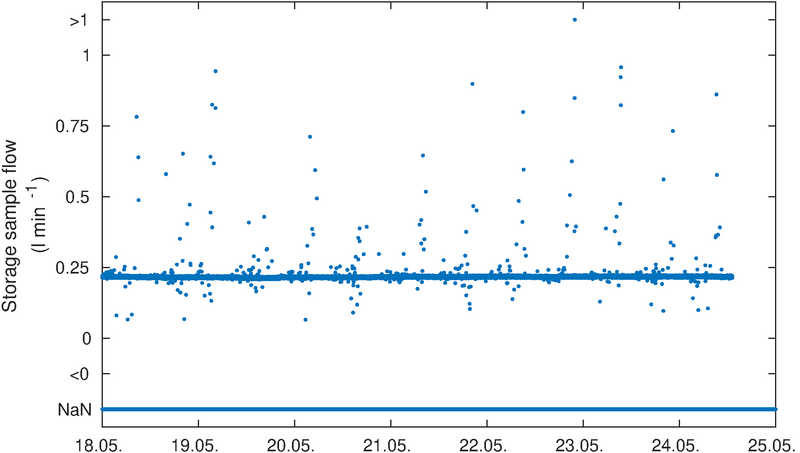
CO2 and H2O storage sample flow, raw data at 1 Hz.
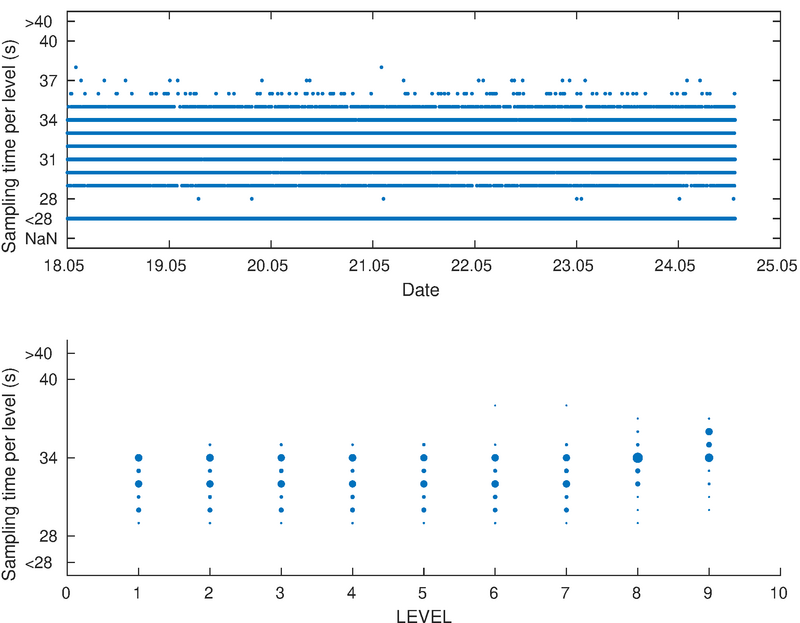
CO2 and H2O storage measurement, sampling time distribution.
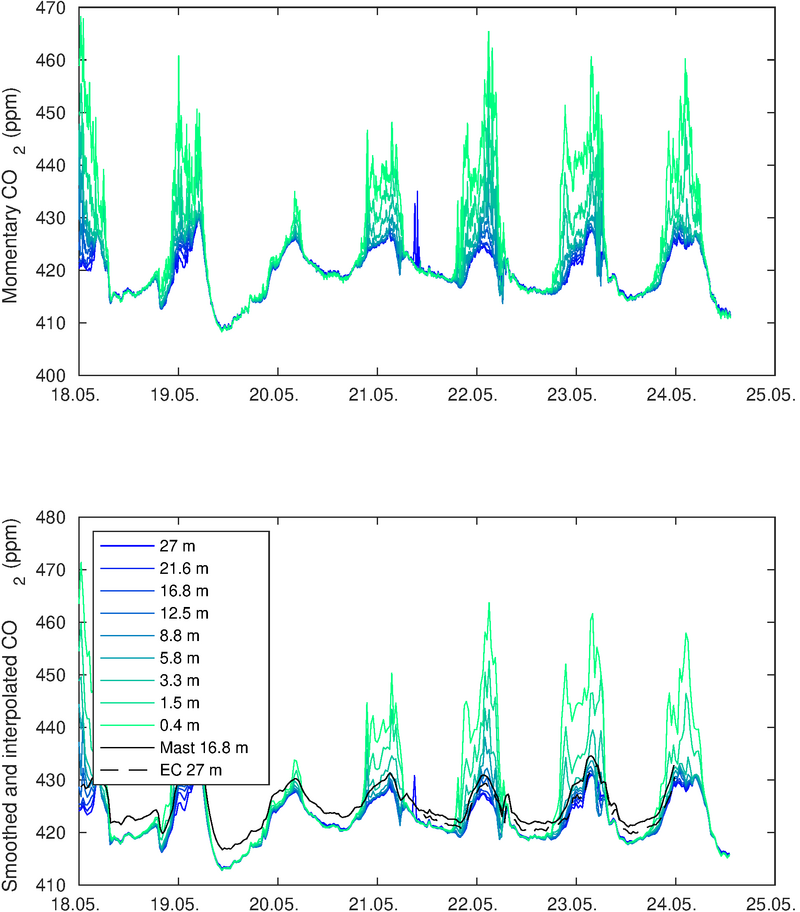
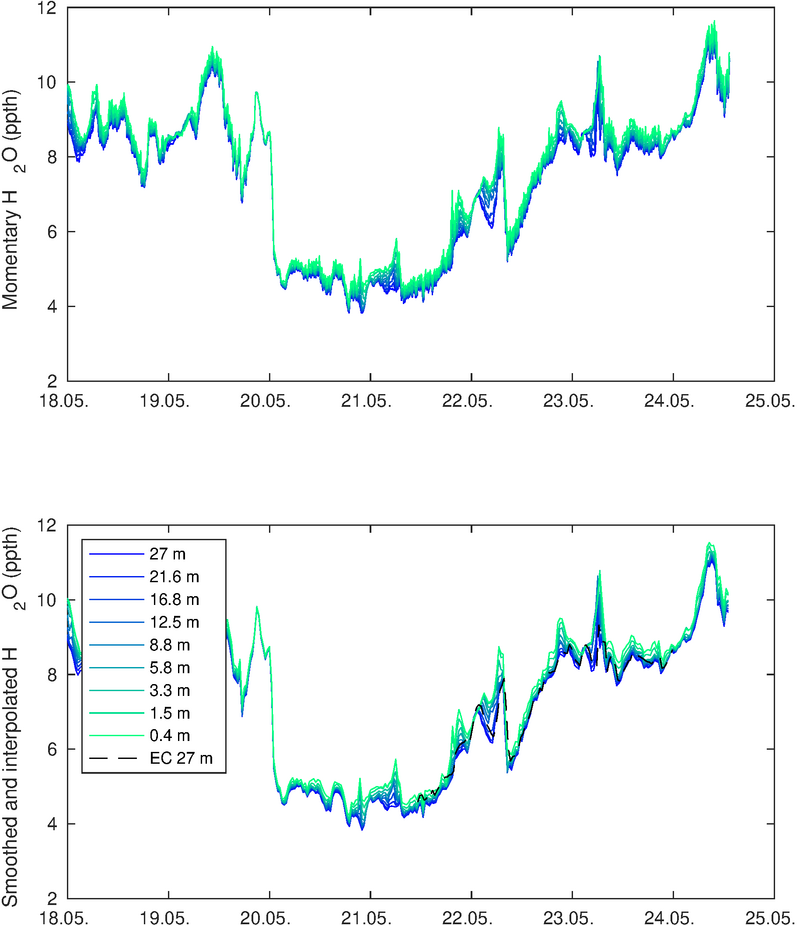
CO2 and H2O storage measurement, gas concentrations at different heights.
Top panels: original data, bottom panels: interpolation to 00 and 30 min.
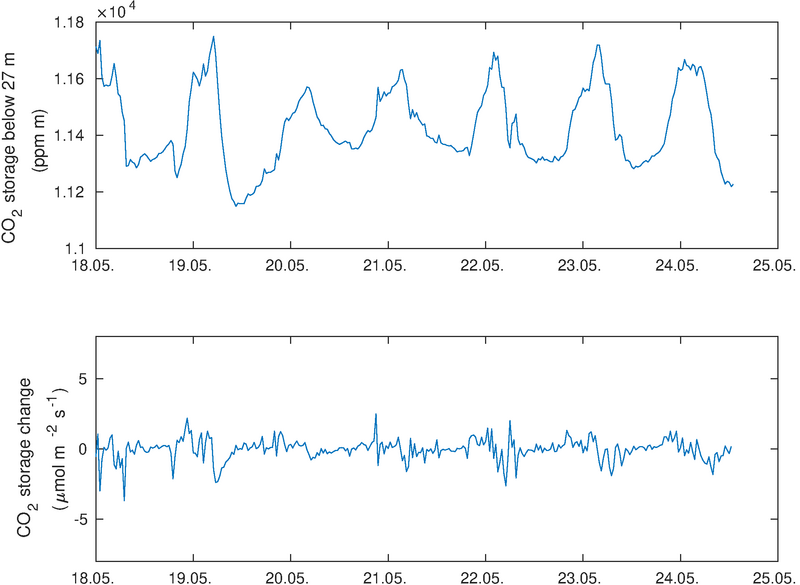
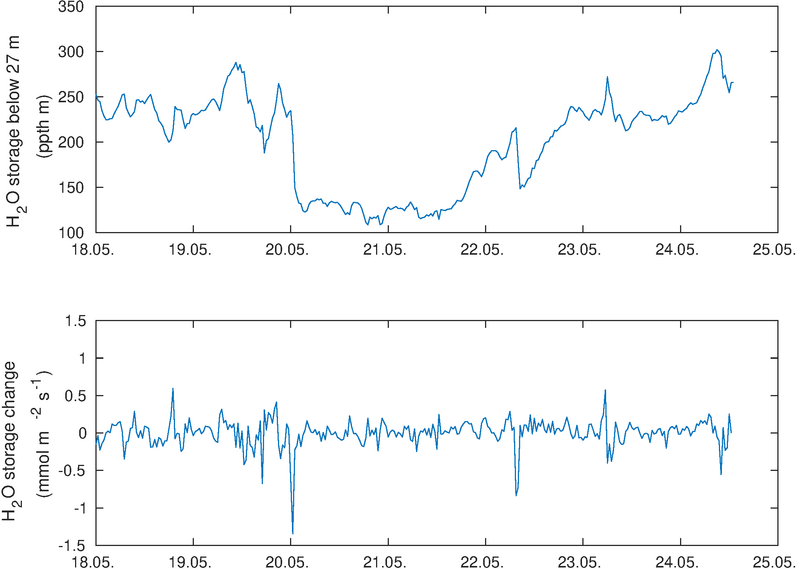
CO2 and H2O storage (top panels) and 30 min storage change (bottom panels),
CO2 storage change should be smaller than +-5 µmol m-2 s-1, H2O smaller than +-1 mmol m-2 s-1.
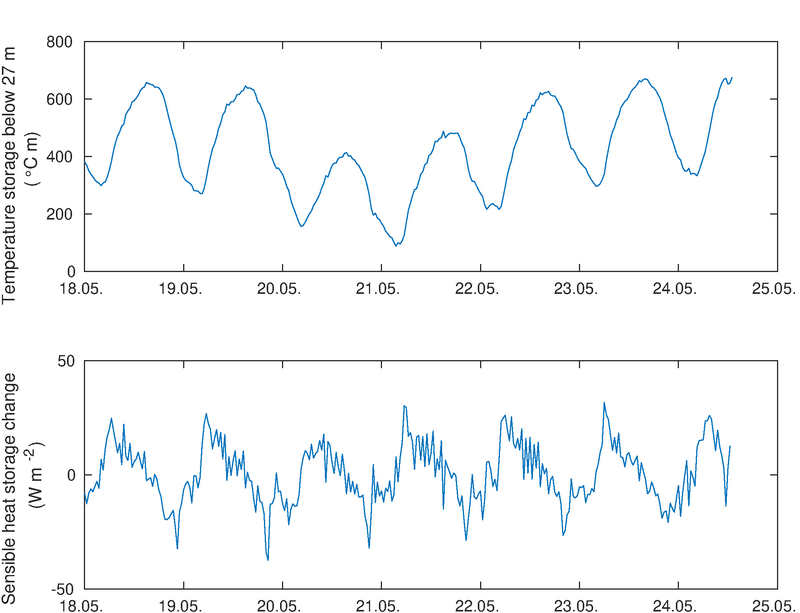
Sensible heat storage (negative below 0°C, top panel) and 30 min storage change (bottom panel) from temperature profile.
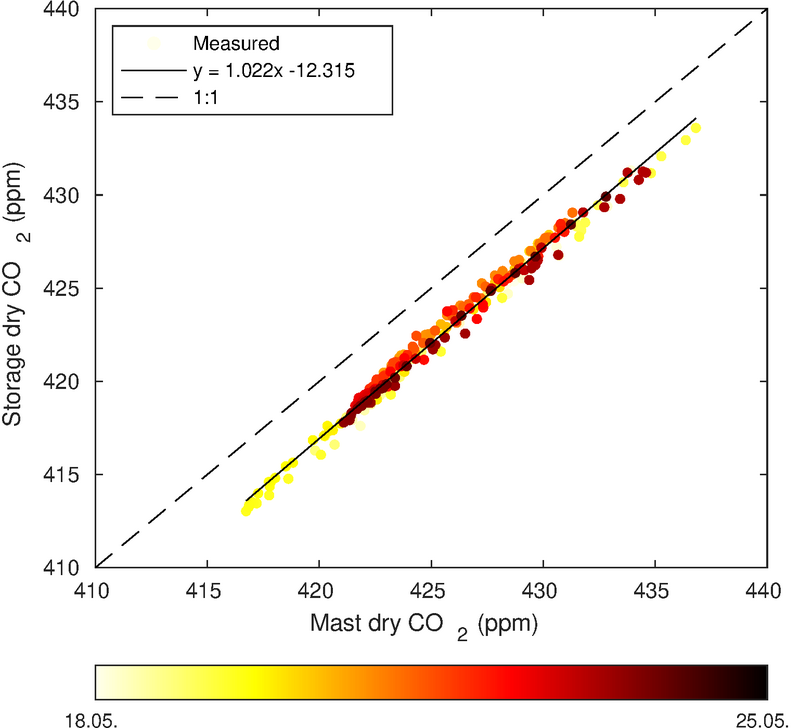
Storage CO2 and H2O at 16.8 m vs ICOS AS measurements at 16.8 m during last 7 days.