Handling Machine Observation Data
URN:NBN:fi-fe2024042522001
Version 2024-04-25
Mikko Heikkinen & William Morris
Updated version of this report can be accessed here: https://wiki.helsinki.fi/xwiki/bin/view/FinBIF/FinBIF/FEOFinBIF/Machine%20Observations/
Introduction
Machine observations refer to the data collected about natural environments using sensors. This can happen in two main ways: either humans have not directly observed the organism, relying instead on automated photographs or audio recordings made by devices, or humans are involved in collecting the data, like taking photographs or collecting soil or water samples. Automated tools can also be used to identify the organisms present, e.g. through DNA sequencing or AI-based computer vision software.
The production of machine-generated data is on the rise, and it's predicted that such data will eventually surpass the volume of observations made directly by humans. Affordable devices, such as the Audiomoth, which costs under 100 euros and can record birds and bats, make it feasible to gather large amounts of data efficiently. This affordability allows for broader and more constant monitoring of nature, covering more species, around the clock, and in multiple locations.
This influx of data, which can include tens of thousands of observations from a single device in one day, necessitates new methods for storage, access, and analysis. To ensure that data remains comparable over time, despite technological advancements, meticulous planning and documentation of methods are essential.
Our project develops such frameworks. As we gather more machine-generated data, these guidelines will evolve to better manage the information.
Data handling can be broken down into three stages: the initial raw data from devices, such as audio files; interpreted data, where specific segments are identified to species level; and aggregated data, summarized in a way that's useful for research and conservation.
Managing this data involves several key considerations:
- Designing and documenting collection and management practices.
- Addressing data ownership, research embargoes, and privacy concerns.
- Storing vast amounts of raw data, which can be space-intensive and require a high rate of data ingress.
- Utilizing artificial intelligence to interpret raw data accurately.
- Aggregating interpreted data in a useful manner, avoiding information overload by potentially limiting the data shared. This depends on the context and could be e.g. one observation per species, per day, per location.
- Sharing data while managing sensitivity and privacy, as platforms like Laji.fi already do with sensitive information.
We based this report on data from VMI-BIODIV project (camera traps, spore samplers), bird and bat audio data collected with Audiomoth and Wildlife Acoustics recorders and analyzed with BirdNET Analyzer software, and experiences from various research projects at Luomus, such as satellite tracking of birds and ultrasonic audio monitoring of bats.
AMI Trap data was not used, since the traps could only be deployed late in fall 2023, not providing substantial data yet.
Machine observation methods
There are many methods using automated machine-based systems for collecting (or identifying; see section observation vs. identification below) biodiversity data. New methods are being developed all the time with the field moving at an ever-increasing pace. Broadly, there are five categories of automated/machine-assisted biodiversity data collection in operation today; trackers, visual detectors, audio detectors, molecular detectors and remote sensing.
Trackers are used more or less exclusively for mobile organisms, historically, larger mammals, reptiles and birds, though as newer, lighter and more compact tracking technology is developed, smaller and smaller animals (even including some invertebrates) have been able to be tracked. Tracking differs from other methods in that the identity of the taxon and individual is known before data collection begins, and the data collected is for the purpose of learning about the locations specific organisms can be found in at particular times, or relative to other tracked organisms or entities. Trackers can be global in scope by using satellite networks or light-level geolocators, or local and fine scale by using fixed or mobile radio telemetry.
Visual detectors utilise photographic or video cameras typically deployed in fixed locations and triggered by movement to capture still or moving images of organisms that pass in front of them. Cameras can also be affixed to moving bodies such as remotely operated or (semi)-autonomous drones. The images/videos can later be processed manually or automatically to elucidate data such as taxonomic identification, abundance, behaviour or other variables.
Acoustic detectors operate similarly to visual detectors but are limited to the detection of organisms that reliably emit recognisible sounds, typically birds, bats, frogs, insects or cetaceans.
Molecular detectors are a broad category that include modern methods for recording biodiversity using chemical signals. Commonly, DNA is the target compound which could be directly sourced from organisms manually (e.g., sampling plants) or automatically (e.g., insect traps) or indirectly via sampling some facet of the environment like the air, soil or water for so called eDNA. Samples are then processed, often ex situ in a lab, and the results compared to DNA databases, to identify the organisms present in the samples.
Remote sensing includes all methods for recording biodiversity data at a distance. A common example is the use of satellite imagery to map and identify vegetation. Modern remote sensing methods can in some circumstances be accurate and fine-scale enough to map and identify individual trees in a forest canopy.
Data formats
Data formats from various automated sources vary significantly. Managing these diverse formats effectively is critical to ensure their long-term usability and integration into larger datasets.
Making Machine Observations: The initial step involves standardizing outputs from sensors and detectors to simplify data aggregation and analysis. It is important to prioritize the use of open-source and widely supported formats such as WAV or FLAC for audio, JPEG or PNG for images, and plain text, CSV, JSON, or XML for textual and numeric data. These formats are not only accessible but also recommended for long-term data storage due to their stability and broad acceptance. While proprietary formats are sometimes unavoidable, they should be converted to open formats to ensure future accessibility and compliance with long-term storage standards.
Identifying Machine Observations: Identification processes can yield multiple data formats, and it is vital to retain the original formats for archival purposes to ensure that no information is lost in format translation or premature filtering. For instance, data should not be filtered based on the expected commonness of species.
For practical applications, such as sharing and analysis, data should be mapped to standardized formats. This step may include filtering out uncertain, improbable, or less relevant data points.
Advanced data management strategies, such as implementing data lake or lakehouse architectures, provide flexible solutions for storing both raw and processed data. These systems support scalable management of large datasets and enable complex analytical operations without compromising the original data structure.
Documenting Data Formats: Each dataset should include comprehensive metadata documenting all the data formats produced. This documentation is essential for understanding the dataset's structure and ensuring that the data remains interpretable and useful for future research and analysis. Proper metadata facilitates better data stewardship, enhances the dataset's reliability, and supports its integration with other data sources, thereby amplifying its value to the scientific community.
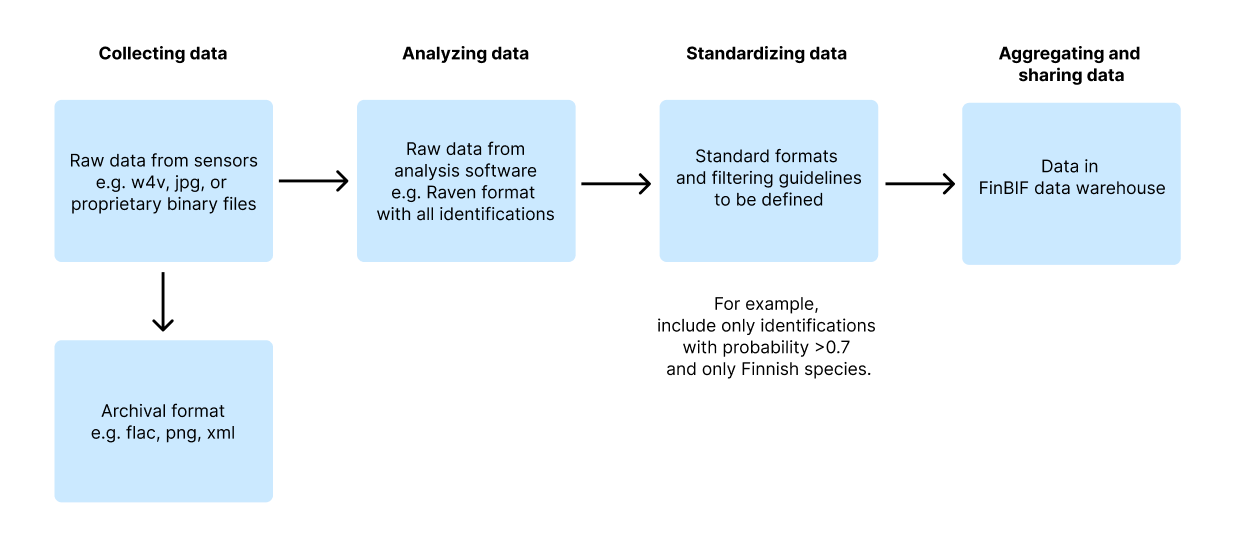
Figure 1: Possible data pipeline from collecting data with sensors to archival and sharing the data:
Automatic observation vs. Automatic identification
Machines or automated systems can be used to both collect (see above) biodiversity data and to make taxonomic identifications of biodiversity data based on some digitized evidence. Whether or not biodiversity was collected entirely by an automated system, or a person was involved at some point in the process, modern machine learning methods can now be used to check identifications or perform the identification entirely. Model-based identification (classification) can be much faster, especially with high volume or high frequency data, than manual identification and is becoming increasingly more accurate as new models are trained and publicly released. Typically, a model will be more appropriate for certain taxonomic groups or certain regions (e.g., birds of North America) and be less reliable outside the range of the data they were trained on. But more globally useful models are becoming prevalent.
Metadata and data fields
FinBIF data warehouse and portal (Laji.fi) already includes extensive schema (schema.laji.fi) for both dataset metadata and occurrence records. It can ingest machine observations but should be extended to incorporate data specific to them. The following section outlines essential metadata and data fields that should be adapted or added to the existing FinBIF data model to accommodate machine observations.
Dataset-Level Metadata
- Sensor/Device Information: Details such as the name, version, and firmware of the sensors used in data collection. This helps in understanding the technological basis of the data.
- Setup Description: Describes the configuration of sensors, including their placement and any software settings or modifications, which can be vital for interpreting the data.
- Recording Schedule: Information on whether devices record continuously or are triggered by specific events, which influences the data's interpretative context.
- Identification Details: Specifies if identifications are AI-driven, detailing the models, versions, and settings used. This is crucial for evaluating the reliability of the data.
- Data Processing: Outlines any conversions, identifications, and filtering applied to the raw data, providing insights into how data is refined for analysis.
- Data Quality: Introduces a new categorization for unknown data quality, relevant where AI-based identifications are involved, and verification may be incomplete. Existing quality levels can be used for documenting verification processes.
- Data Storage: Details on long-term and accessible storage locations for data, ensuring data preservation and accessibility.
- Data Formats: Documentation of both raw and converted data formats.
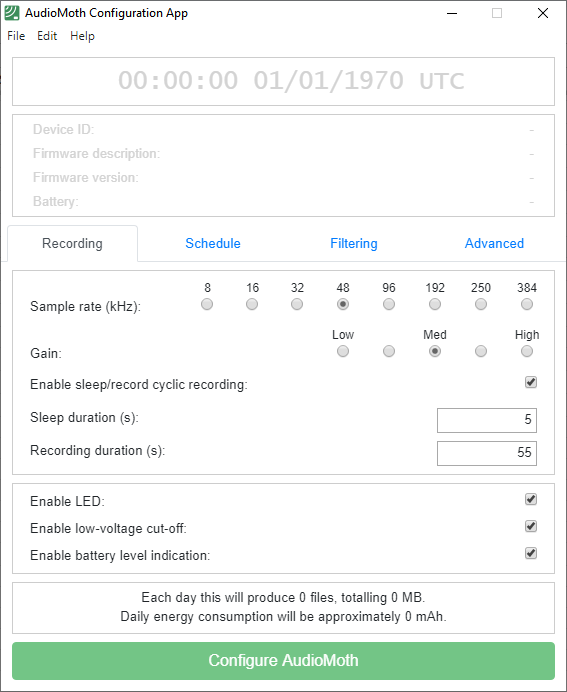
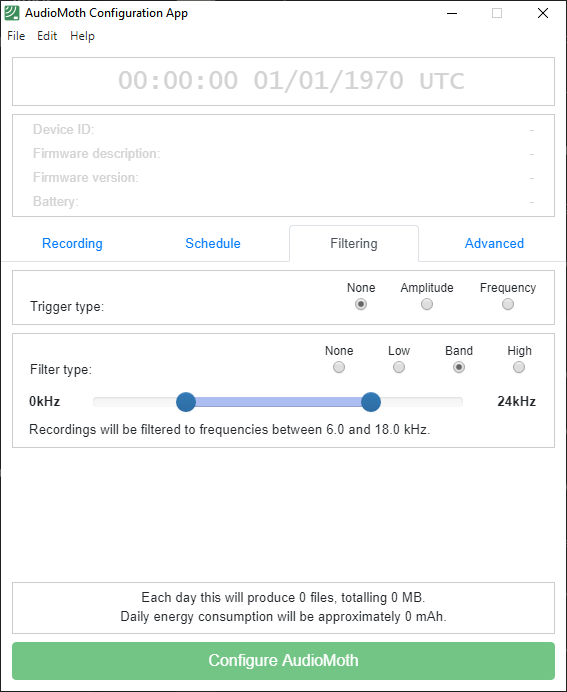
Appendix 1 shows some settings of the Audiomoth recording device, which should be documented in the metadata (sensor information and schedule).
Occurrence-Level Fields
- Geospatial Accuracy: Existing accuracy field can be used to describe the precision of the location data. This can be challenging to determine in some methods, such as audio detections from distant sources.
- Abundance: Description of taxon abundance, if that can be evaluated from the data. Usage of this field should be standardized and/or described in the dataset metadata.
- Record Basis: Expanding an existing field to include new sources like camera traps, audio recorders, and environmental samplers.
- Identification Basis: Adding a new value for automated or AI-driven identifications.
- Model Confidence Value: Confidence levels provided by AI models are normalized between 0 and 1, ideally using calibrated values for consistency.
- Reference to Original Data File: Persistent identifiers (PIDs) for data files (one or many) to trace observations back to their original context, which critical for verification and review.
- Timestamp for Data Retrieval: Specific timestamps or other markers to locate relevant segments within larger data files, facilitating precise data retrieval and review.
Appendix 2 includes a list of additional data fields that could be incorporated, if necessary. It is not comprehensive, as new methods can provide a wide variety of additional data.
Data storage & volume & aggregation
Key issues arising from the increasing prevalence of machine-based methods for collecting and identifying biodiversity data is how to cope with the orders of magnitude increase in the volume and throughput of data that is already occurring and is likely to compound in the future. Data producers, and aggregators will need to address both the storage of these new sources of data and have the bandwidth needed to handle data ingress as automated methods become the predominant source of data in what is possibly the near future. Beyond simply handling the data in increasing volume and frequency data. Data providers will have to innovate ways to present these data that is tractable to data users. High volume/resolution/frequency data is more difficult to visualise and reason about than legacy occurrence data that has in the past been presented as tables or in a map in more or less its raw state. The simplest approach initially may be to aggregate these new data in such a way that they resemble the biodiversity data that users have been accustomed to. However, new methods to present and visualise data will need to be developed in order that the full benefit of new data can be realised.
Data quality
The quality of machine observation data is contingent on numerous factors. The primary challenges involve addressing data accuracy, error management, biases, and implementing robust quality assurance protocols.
Accurate data collection is fundamental and relies heavily on the proper selection and use of sensors (trackers, recorders, cameras etc.). These devices must offer resolution that matches the requirements of each study. Despite technological advances, errors are inevitable. Systematic errors, which are consistent and predictable, need to be identified and corrected, while random errors should be quantified using statistical methods to assess data reliability.
Another major concern is bias. Automated systems may not uniformly sample biodiversity due to limitations in sensor placement or range, leading to skewed data that overrepresents or underrepresents specific species or conditions. Additionally, if data processing employs machine learning techniques, algorithmic biases can influence the findings.
To enhance data quality, quality assurance and control procedures should be established. This includes validation and verification efforts that may involve cross-checking data with manual observations and regular maintenance and monitoring of the equipment used. Data cleaning routines are also important to eliminate incorrect or outlier data points.
Documentation is equally important; comprehensive metadata that covers all aspects of the data collection process should be maintained. This includes details about the sensors and identification methods and their configurations.
However, it's essential to recognize that despite the best efforts, the quality of machine observation data cannot be fully guaranteed. The field is rapidly evolving, and continuous learning and adaptation of new methods are required. Data collected with different methods are often not directly comparable. Current strategies should focus on improving data quality where possible and thoroughly documenting any identified issues, errors, and biases.
Future & uncertainties
It seems certain that in the future machine-based automated methods will be a major if not the predominant way that biodiversity data is both collected and identified. What is less is certain is how this shift from human-based collection and identification will be handled. More computing resources will be needed to handle the higher expected volume of data and the increase in processing power needed to mobilise data and run classification models. It is an open question as to how new machine-based data can be aggregated and presented to be tractable to future data users. At some point in the future, if current trends continue, machine-based identification systems should be exceptionally reliable and equal if not surpass human taxon experts. In the interim however, machine-based identification will have to be used with caution and in many circumstances, it will be important to find ways in which to summarise and communicate in as clear a manner as possible the uncertainty inherent in machine-based identification.
Appendix 1: Examples of sensor & analysis software
The AudioMoth Configuration App (version 1.9.0) is designed to configure Audiomoth recording devices.
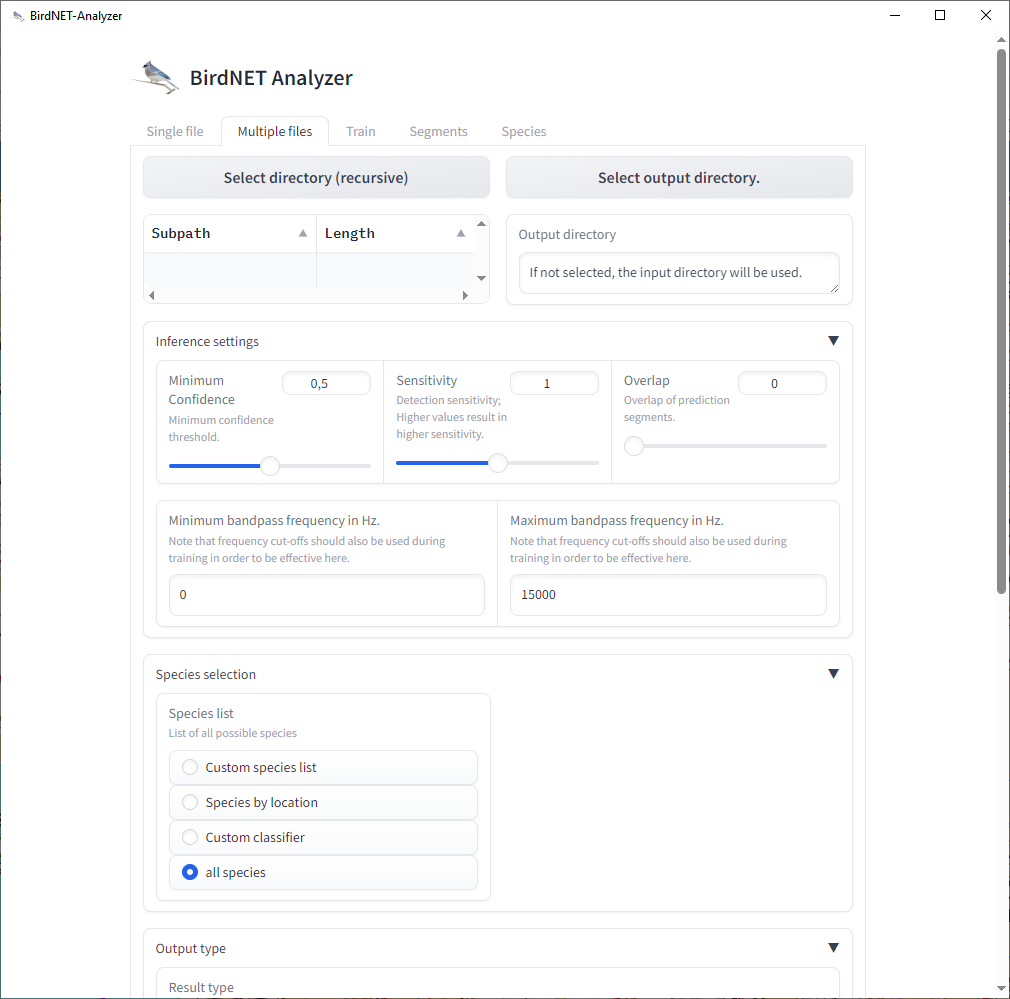
The BirdNET-Analyzer application (version 1.0.2) is designed for identifying bird audio recordings. Given the various combinations of recorder (above) and identification application settings—such as sample rate, gain, triggering, model version, confidence, sensitivity, and overlap—it is challenging to compare results reliably.
Appendix 2: Machine observation data fields
This list is not exhaustive nor is it a recommendation of what should be captured, but gives an idea of what kind of information could be stored.
The data fields are divided into categories, such as device, recording event, AI-based taxon identification, data quality assurance and storage.
Device
Device name
Name and version of the device.
For example, Audiomoth 1.2, or Wildlife Acoustics SM4.
Firmware name and version
Name and version of the firmware used in the device.
Device description
More detailed description of the device and its capabilities, including any modifications (hardware or software) or accessories. For example, maximum audio frequency.
Recoding event
Device placement
Notes about how the detector device (camera, audio recorder, sampler or such) is placed; anything that can affect the results. As an example, waterproof case, thick plastic bag and thin plastic bag can affect sound quality differently for different frequencies.
For example, height, direction and/or cover of the recording device. For example, "1.5 m above ground, facing south, in an Audiomoth waterproof case".
Triggered
Whether the recorder was on continuously, or triggered only e.g. by sound or movement.
Boolean: true (triggered) or false (continuous).
Daily schedule
When the recorder device was recording.
Example: 20.00-08.00.
Detailed schedule
More detailed description of when the recorder was recording. Also include if the schedule was interrupted e.g. due to battery running out.
Example: 5 minutes per each 30 minutes, or 6 hours starting from sunset but no more than until sunrise.
Trigger type
Description of the trigger type. For example, amplitude, frequency, movement, light or other. Also duration of the recording after the trigger.
Trigger value
The value(s) that triggers the recording. For example, "band of 0-24 kHz".
Conversions
Any filtering or conversion applied to the data before further analysis. For example, "high-pass filter at 20 kHz" or "48 Hz DC blocking filter".
Audio sample rate in kHz
Audio sample rate of the recording.
Audio bit depth
Audio bit depth of the recording.
Audio gain
Audio gain setting. For example, low, medium or high.
Audio type
Stereo, mono or other.
Audio format
Audio format of the recording. For example, WAV, FLAC or MP3.
Image resolution
Resolution of the images. For example, 1920x1080 pixels.
Image format
Image format used for recording. For example, JPEG, PNG or TIFF.
Lighting description
Description of the lighting. For example, visible light, infrared or combination of both.
Light source
Description of the light source used for imaging. For example, visible light or infrared. Possible more detailed description of the light source(s), or if they vary during the recording.
AI-based taxon identification
Model name and version
Model name used for identification.
Example: BirdNET_GLOBAL_2K_V2.1 or BirdNET v2.4
Prefer unique identifiers, since names can have different spellings like in the example here.
Confidence level
Confidence level used for identifications
Needs to be normalized so that all values are between 0...1, with zero representing minimum confidence and one representing maximum confidence.
Sensitivity
Sensitivity of the model used for identification. Can be different for different models.
Segment length
Length of audio segments in seconds used for identification
Overlap of segments in seconds
How much segments used for identification are overlapping.
With zero overlap, vocalizations at the border between two segments are easily missed. With overlap, some vocalizations can be counted twice or more.
Identifications per segment
Maximum number of identifications the system tries to make out of a single segment.
Data quality assurance
Verification methods
Description of how identifications made by AI have been verified.
Should this be machine-readable, so it can be used for filtering data? The would need separate machine-readable vocabulary and human-readable detailed description.
Possible vocabulary:
- None
- Spot checked
- Full verification by experts
Storage
Media file format
File format of the media files (audio, video etc). For audio files for example, WAV or FLAC, mono or stereo.
Interpreted file format
File format of the interpreted data. For example, CSV, JSON or XML.